Context:  
India’s Consumer Price Index (CPI) based inflation rate touched 5.69% in December.
 
Consumer Price Index (CPI): Year on Year Inflation Forecast (FY 2023-2024)
- Headline Inflation Rate: December data shows that the Year on Year (YoY)  inflation rate has started rising towards the end of 2023. 
 

- 
- Reason: The relative spike in food prices in 4 food groups accounted  for 23% of the total index weight  relative to December 2022.
- Vegetable prices increased by almost 28%  
 
- Pulses were costlier by 21% 
 
- spices by 20%.
 
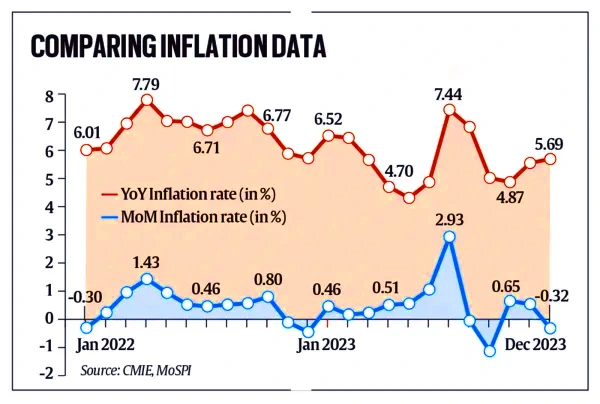
Cereals, too, were costlier by 10%.  
 
- Regional variation: Odisha is registering the highest inflation at 8.7% and Delhi is experiencing the lowest at 2.9%
 
 
- Core Inflation Rate:  It is the inflation rate after removing the food and fuel inflation that is showing a decreasing trend.
 
-  FY 2023-2024:  Inflation for the full financial year will likely remain at 5.5%.
 
What is the Consumer Price Index (CPI)?
-  About: Consumer Price Index (CPI) measures changes over time in the general level of prices of a basket of selected goods and services that households acquire for the purpose of consumption.
 
- Prepared  by:  National Statistical Office (NSO),  Ministry of Statistics and Programme Implementation (MoSPI)
 
- Consumer Price Index (CPI) basket: It comprises 299 items.
 
- Types: 
- CPI for Industrial Workers (CPI-IW): Compiled by NSO
 
- CPI for Urban Non-Manual Employees (CPI-UNME): Compiled by NSO
 
- CPI for Agricultural Labourers (CPI-AL): It is used to calculate minimum wages in the agricultural sector across different states and compiled by NSO
 
- CPI for Rural Laborers (CPI-RL): Compiled by the Labor Bureau, it reflects price movements specifically for rural laborers.
 
 
- Base year: It is 2012  for the current series of indices.
 
- Method: The monthly price data is collected from 1181 villages and 1114 urban markets spread all across the country. The data for this purpose is collected on a weekly basis by the field staff of NSO.
 
- Components: Consumer Price Index has 6 main components with differing weights 
- Food and beverages (45% weight overall with Cereals accounting for 9.67% of the total)
 
- Pan, tobacco, and intoxicants (2.38%)
 
- Clothing and footwear(6.53%) 
 
- Housing  (10.07%)
 
- Fuel and light (6.84%)
 
- Miscellaneous (services such as education, health care etc.) (28.32%)
 
 
News Source: THE INDIAN EXPRESS