An analysis by the Household Consumption Expenditure Survey (HCES) shows that consumption inequality in the rural areas of 11 states has increased.
Consumption Inequality Increased in Rural Areas of 11 States
- The Gini coefficient of total consumption expenditure saw an increase between the periods 2011-12 and 2022-23 as per the survey in rural areas.
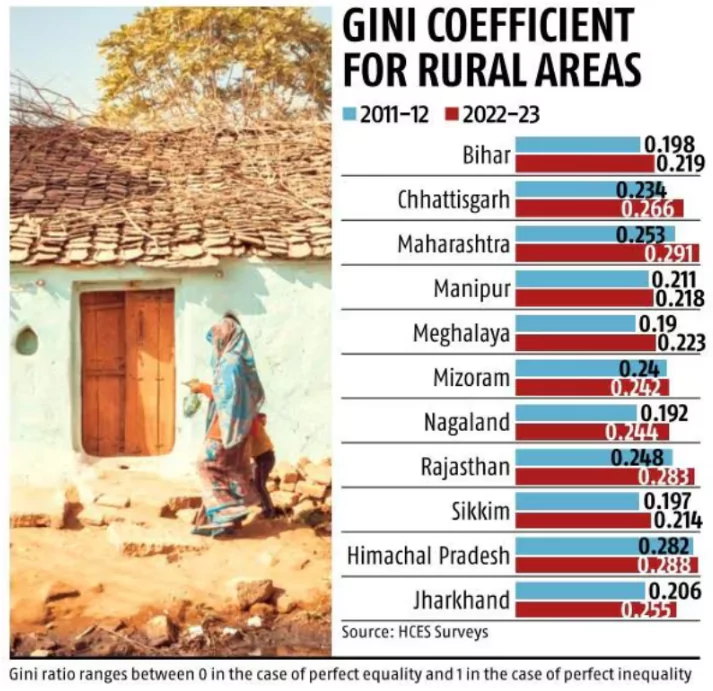
- 11 out of 25 states taken for analysis, recorded an increase in the GIni Coefficient value.
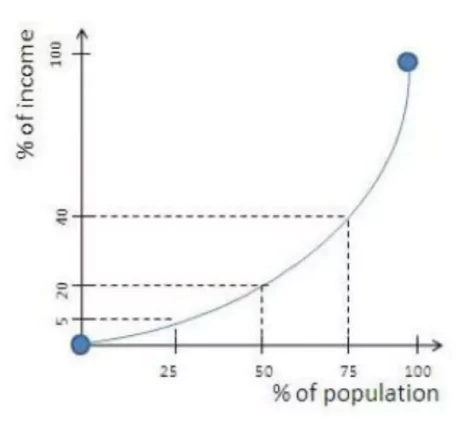
- Rural Areas: The rise in Gini coefficient was the sharpest in Nagaland (0.244 from 0.192), followed by Jharkhand (0.255 from 0.206), Maharashtra (0.291 from 0.253), Rajasthan (0.283 from 0.248), Meghalaya (0.223 from 0.19) and Chhattisgarh (0.266 from 0.234).
- Urban Areas: The Gini coefficient for consumption expenditure has also risen in urban areas for three states ie. Meghalaya (0.266 from 0.226), Himachal Pradesh (0.311 from 0.29) and Manipur (0.221 from 0.209).
- National Trend: At the country level, The Gini coefficient of total consumption expenditure recorded a general decline showing a decline in spending inequality in the country.
- The Gini coefficient has gone down to 0.266 in 2022-23 from 0.283 in 2011-12 (rural areas). For urban areas, it has gone down to 0.314 from 0.363 during the same period.
Enroll now for UPSC Online Course
About The Household Consumption Expenditure Survey (HCES)
- The HCES survey is designed to collect information primarily on consumption of goods and services by the households and also collects some auxiliary information on household characteristics and their demographic particulars.
- Purpose: The Information collected in HCES is useful for understanding the consumption and expenditure pattern, standard of living and well-being of the households.
- The data is used for preparation of the weighting diagram for compilation of official Consumer Price Indices (CPIs).
- Conducted by: The National Sample Survey Office (NSSO)
- Survey Coverage: The survey is an All India exercise. Information has been collected from 8,723 villages and 6,115 urban blocks covering 2,61,746 households (1,55,014 in rural areas and 1,06,732 in urban areas) in total.
- The consumption basket: The Items basket has been divided into three broad categories, namely, Food items, Consumables and Services items, and Durable goods in HCES: 2022-23.
About The Gini Coefficient
The Gini Index determines a nation’s level of income inequality by measuring the income distribution or wealth distribution across its population.
- Developed by: The Gini index was developed in 1912 by Italian statistician Corrado Gini.
- Scale: Gini coefficient measures inequality on a scale of 0 (or 0%) to 1 (or 100%), with 0 representing perfect equality and 1 representing perfect inequality.
- World Bank ranking: South Africa has the world’s worst level of income inequality, with a Gini index ranking of 63.0% and Norway had the lowest level of income inequality, at 22.7%.
- India has a Gini Coefficient of 32.8 as per the World Bank in 2021.
- Graphical Representation: The Gini index is often represented graphically through the Lorenz curve.
|
To get PDF version, Please click on "Print PDF" button.