Trends in India’s Labour Market
- The State of Working India 2023, published by the Centre for Sustainable Employment shows major trends in India’s labor market.
- The analysis uses data from surveys by the National Statistical Office including Employment- Unemployment Surveys and the Periodic Labour Force Surveys.
- Changing compos itinerary of employment type with caste:
-
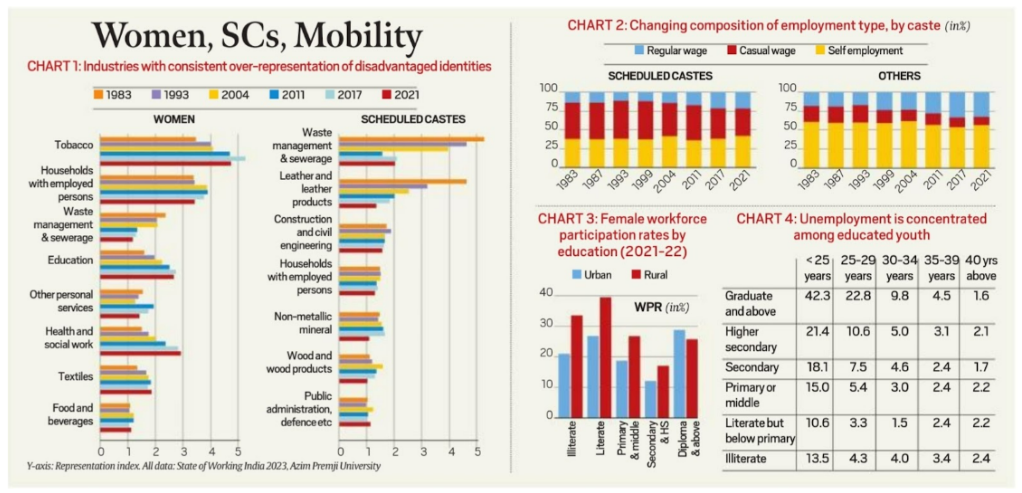
- Regular wage workers: Charts 2 (top right) shows that between 1983 and 2021, the proportion of regular wage workers belonging to SCs increased, but remained significantly lower than the proportion of regular wage workers in the ‘Others’ (general) category (22% against 32% in 2021).
- Self Employment: The rate of self-employment was also higher among the ‘Others’ compared to SCs.

- Differential intergenerational upward economic mobility: In 2004, 86.5% of sons of SC/ST casual wage were also casual wage workers; this fell to 75.6% in 2018. The fall for sons of ‘general’ caste casual wage worker fathers was steeper -from 83.2% to 53% over the same period.
Female workforce participation rate(Chart 1):
- Prominent industries: Women’s representation in industries like tobacco, education, health and social work, and textiles increased between 1983 and 2021, and decreased in waste management and sewerage over the same period.
- However, compared to men, women continued to be overrepresented in these sectors.
- Over this same period, the share of SCs in industries like waste management and sewerage, and leather and leather products fell sharply.
- However, SCs remained overrepresented compared to other castes.
- Factor of husband’s income: As it increases, the probability of the wife being employed reduces (the male “bread-winner” norm). In rural areas, this trend is slower.
- Urban areas show a fall in the probability of the wife being employed up to the earnings threshold of Rs 40,000 per month.
- As the husband’s earnings increase beyond this, the probability of the wife being employed also increases. This is because husbands in higher income brackets have better-educated wives with aspirations and access to better-paid work.
- Factor of mother-in-law presence and status: Compared to households where no mother-in-law is present, married women in households with an unemployed mother-in-law are 20% (rural) to 30% (urban) less likely to be employed.
- However, if the mother-in-law is employed, the likelihood of the married woman being employed rises from 50% (rural) to 70% (urban).
- The presence of an unemployed mother-in-law in the household significantly reduces the likelihood of a married woman being employed;
- The presence and employment status of a mother-in-law is therefore a determinant of whether married women participate in the workforce.
Female participation rates by education(Chart 3):
- Except for “diploma and above”, women in rural areas have higher workforce participation rates for all levels of education compared to women in urban areas.
- The analysis also notes that as of 2021-22, about 40% of SC women were employed, as opposed to only 21% of ‘general’ caste women.
Concentration of unemployment among educated youth(Chart 4):
- Among those younger than 25 years, graduates have the highest unemployment rate of all education levels.
- The unemployment rate reduces as the education level decreases.
- As people grow older, the probability of their being employed increases, mostly because unemployment becomes unsustainable.
![]() 26 Sep 2023
26 Sep 2023
