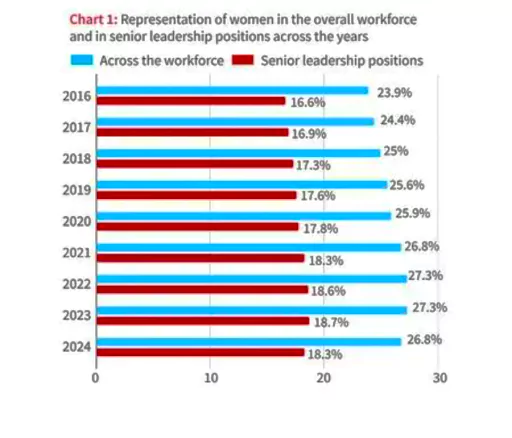
According to LinkedIn’s Economic Graph data, women’s participation in the workforce and senior leadership positions has plateaued since 2022 and experienced a decline in 2024.
Trends in Women’s Workforce Representation
- Stagnation: Women’s workforce representation has seen growth over the years but stagnated since 2022 and experienced a decline in 2024. Similarly, advancements in elevating women to senior and leadership positions have also stagnated.
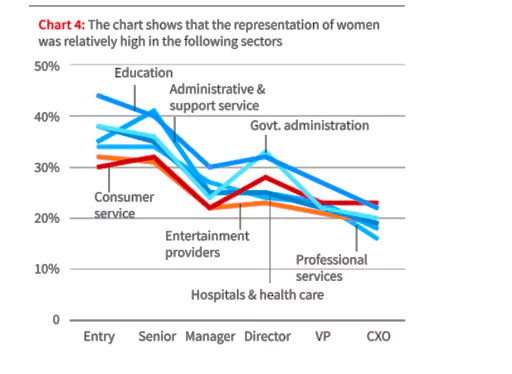
- Employment of Women across Industries: Women are predominantly represented in senior positions within healthcare, education, administrative, and support services.
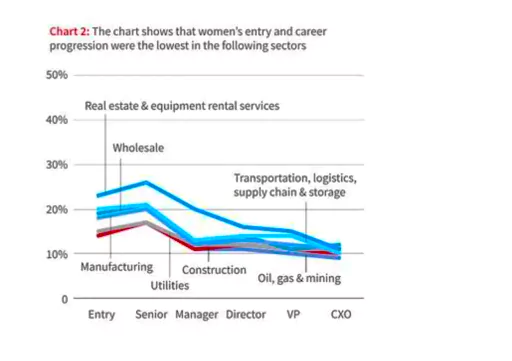
- Conversely, their presence across all positions remains minimal in manufacturing, construction, oil, and gas industries.
Enroll now for UPSC Online Course
Women Workforce Representation Across Industries

- Slow Progression: The promotion of women to senior leadership roles has been gradual. From 2016 to 2019, the proportion of women in senior positions rose by one percentage point, followed by another increase from 2019 to 2022.
- Current Stagnation: If the decline observed in January 2024 continues, the already slow progress will halt.
- Slowdown in Hiring: The stagnation and decline in the proportion of women in senior roles are due to a slowdown in hiring women for leadership positions. The share rose from 18.8% in 2016 to 25.2% in 2021 but has declined since then.
Women Leadership Representation Across Industries
- Significant Challenges in Specific Sectors: Women encounter the greatest difficulties in entry and career progression within the oil, gas, and mining, construction, utilities, wholesale, manufacturing, transportation, and real estate sectors, where they hold only 11%-14% of leadership roles.

- Minimal Representation in Oil Industry: The oil sector has the lowest proportion of women in leadership, with only about 11% of top positions occupied by women.
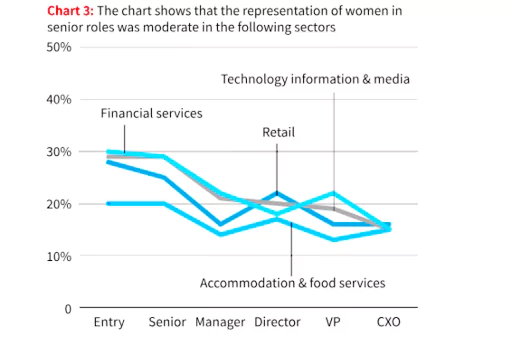
- Accommodation and Food Services: In sectors like accommodation and food services, financial services, retail, technology, and media, women occupy 15% to 20% of senior roles.

- Sectoral Representation: The data indicates that women’s representation in senior positions differs significantly across various industries.
- Representation in Education and Healthcare: Women hold the highest share of senior positions in education (30%) and have significant representation in administrative and support services, healthcare and hospitals, consumer services, government administration, and education, with percentages ranging from 22% to 30%.

Check Out Previous Years Papers From PW Store
![]() 3 Jun 2024
3 Jun 2024


