Graphical Representation of Motion: Distance-Time & Velocity-Time Graphs

14 Dec 2023

The Power of Graphs in Understanding Object Motion

Graphs are a powerful tool for visually representing the motion of objects, enabling clearer understanding and analysis.
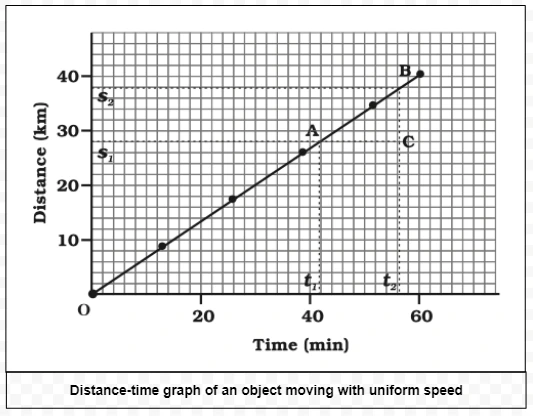
Distance–Time Graphs: Graphical representation of Motion

Distance-time graph of an object moving with uniform speed

  • These graphs depict the graphical representation of motion and how the position of an object changes over a period of time.
    • The x-axis represents time.
    • The y-axis represents distance or displacement.
  • Uniform Speed: When an object covers equal distances in consistent time intervals, it’s said to move with a uniform speed.
    • In such cases, the graph is a straight line. 
    • The gradient or slope of this line indicates the speed.
  • Non-uniform Speed:
    • The graph displays non-linear variations when the distance covered varies over time.
    • The specific shape of the curve offers insights into the nature of the non-uniform motion.

Distance-time graph for a car moving with non-uniform speed

Example of Graphical Representation of Motion

 Distance travelled by a car at regular time intervals

  • To determine the speed of an object using a distance-time graph, one can take the following steps:
  • Identify Two Points: Let’s consider two points, A and B, on the distance-time graph.
  • Draw Parallel Lines: From point A, draw a line parallel to the x-axis, and from point B, draw another line parallel to the y-axis. 
  • These lines intersect at a point, C, forming a triangle ABC.
  • Determine Time and Distance: On the graph:
    • The horizontal line segment AC represents the time interval (t2​−t1)​.
    • The vertical line segment BC indicates the change in distance (s2​−s1)​.
  • Calculate Speed: As the object moves from point A to point B, the change in its position is (s2​−s2) over the time interval (t2​−t1)​. 
  • Therefore, the object’s average speed v during this interval is given by:

v =  s2​−s1/t2​−t1

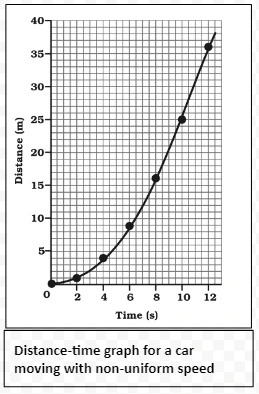
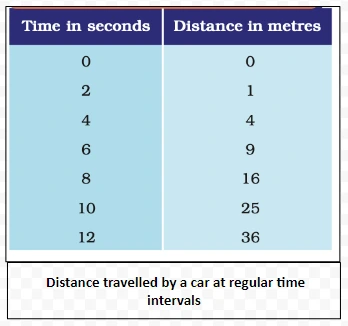
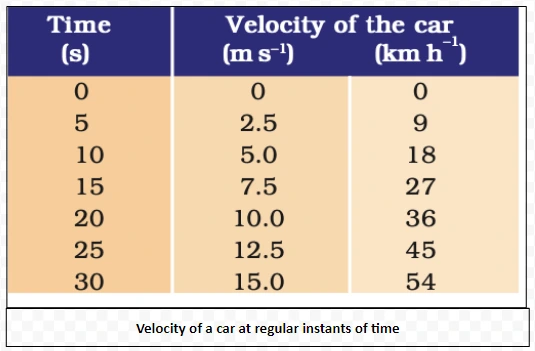
Furthermore, distance-time graphs can also represent accelerated motion. For example, Table 1.1 illustrates distances covered by a car every two seconds, demonstrating an accelerated motion.
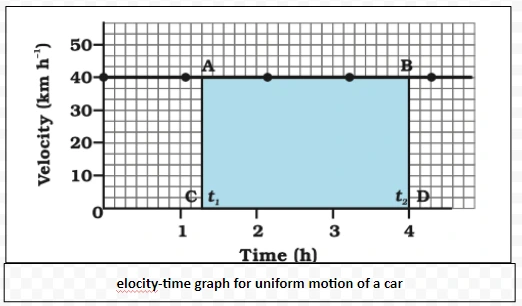
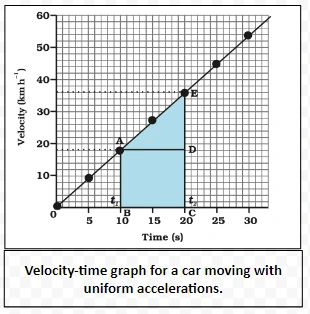
Velocity-Time Graphs: Graphical representation of motion

elocity-time graph for uniform motion of a car

  • These graphs through graphical representation of motion depict how an object’s velocity changes over time.
    • The x-axis represents time.
    • The y-axis represents velocity.
  • Uniform Velocity:
    • When the velocity of an object remains consistent over time, its graph is a horizontal line.
    • The area beneath the graph between two time points indicates the object’s displacement.

Understand the graphical representation of motion Through an Example:

Velocity of a car at regular instants of time

  • Above velocity-time graph is for a car moving at a consistent speed of 40 km/h. 
  • For objects moving at uniform velocity, the product of their velocity and time yields the displacement. 
  • Consequently, the area between the velocity-time graph and the time axis represents the total displacement.
  • To ascertain the distance covered by the car between the time intervals t1​ and t2​ using the above graph one should:
    • Draw Perpendicular Lines: From the points corresponding to times  t1​ and t2​ on the graph, draw perpendicular lines to the opposite axes.
    • Identify Graph Dimensions: The consistent velocity of 40 km/h is depicted by the vertical height (either AC or BD). Meanwhile, the horizontal distance AB represents the time interval t2​−t1
    • Calculate Distance: The distance the car traverses in the duration t2​−t is given by:

s = AC CD 

= [(40 km h-1) (t2​−t1)h] 

= 40(t2​−t1)km. This distance corresponds to the area of the rectangle ABCD.

  • Additionally, to understand uniformly accelerated motion, consider a velocity-time graph. 
  • Envision a scenario where a car undergoes an engine test on a straight road. 
  • An observer in the car logs the vehicle’s speed every 5 seconds using its speedometer. 
  • Above table then showcases the car’s velocity in both km/h and m/s at various time snapshots.

  • Uniformly Accelerated Motion:
    • If the velocity of an object changes by consistent amounts in equal time intervals, the graph will be a straight line that isn’t necessarily horizontal.
    • The total area under the graph represents the distance or magnitude of displacement.
    • This area can be dissected into simpler geometric shapes, like rectangles and triangles, to ascertain the distance.
  • Non-uniformly Accelerated Motion:
    • The velocity-time graphs for non-uniformly accelerated motion can adopt different shapes and configurations.
    • The exact shape of the graph can be interpreted in different ways depending on the motion’s characteristics.

Velocity of a car at regular instants of time

Need help preparing for UPSC or State PSCs?

Connect with our experts to get free counselling & start preparing

Know about Physics Wallah

Physics Wallah is an Indian online education platform, that provides accessible & comprehensive learning experiences to students of classes 6 to 12 and those preparing for JEE and NEET exams. We also provide extensive NCERT solutions, sample papers, NEET, JEE Mains, BITSAT previous year papers, which makes us a one-stop solution for all resources. Physics Wallah also caters to over 3.5 million registered students and over 78 lakh+ Youtube subscribers with 4.8 rating on its app.

We Stand Out because

We successfully provide students with intensive courses by India's qualified & experienced faculties. PW strives to make the learning experience comprehensive and accessible for students of all sections of society. We believe in empowering every single student who couldn't dream of a good career in engineering and medical field earlier.

Our Key Focus Areas

Physics Wallah’s main focus is to create accessible learning experiences for students all over India. With courses like Lakshya, Udaan, Arjuna & many others, we have been able to provide a ready solution for lakhs of aspirants. From providing Chemistry, Maths, Physics formulae to giving e-books of eminent authors, PW aims to provide reliable solutions for student prep.

What Makes Us Different

Physics Wallah strives to develop a comprehensive pedagogical structure for students, where they get a state-of-the-art learning experience with study material and resources. Apart from catering students preparing for JEE Mains and NEET, PW also provides study material for each state board like Uttar Pradesh, Bihar, and others.

Aiming for UPSC?

Download Our App

# #
Quick Revise Now !
AVAILABLE FOR DOWNLOAD SOON
UDAAN PRELIMS WALLAH
Comprehensive coverage with a concise format
Integration of PYQ within the booklet
Designed as per recent trends of Prelims questions
हिंदी में भी उपलब्ध
Quick Revise Now !
UDAAN PRELIMS WALLAH
Comprehensive coverage with a concise format
Integration of PYQ within the booklet
Designed as per recent trends of Prelims questions
हिंदी में भी उपलब्ध

<div class="new-fform">


    </div>

    Subscribe our Newsletter
    Sign up now for our exclusive newsletter and be the first to know about our latest Initiatives, Quality Content, and much more.
    *Promise! We won't spam you.
    Yes! I want to Subscribe.