Upto 60% Off on UPSC Online Courses

Avail Now

DATA Point

Poverty In India: A Progress Review


Context: Recently, the Prime Minister outlined that 13.5 crore plus people came out of poverty in 5 years.


Poverty in India

  • Five official committees have so far estimated the number of people living in poverty in India. 
  • Since 2021, India has abandoned the poverty line measure to opt for the Multidimensional Poverty Index. 


Poverty at the national level:

Poverty In India Estimates

Given the different ways poverty has been measured over the years, the available data is limited and conflicting. 

  • For instance, while the NITI Aayog MPI said 53.7% (625 million) of Indians were poor in 2004-05, the global MPI put the figure at 55.1% (645 million). 
  • According to the national and global MPIs, about 420 million and 415 million people escaped poverty between 2004-05 and 2019-21
  • Poverty in India
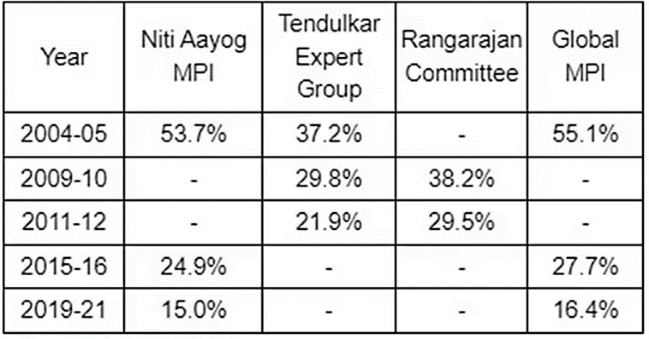
The Tendulkar Expert Group appeared to undercount the poor even more at 37.2% (408 million) in 2004-05.
  • As per the Tendulkar Expert Group, between 2004-05 and 2011-12, about 138 million people were lifted from poverty.
  • Arunachal Pradesh, Mizoram and Nagaland were the only states to see an increase in the poverty rate between 2004-05 and 2011-12. 
  • During this period, nine states saw poverty decline by at least 20 percentage points.


ALSO READ: POVERTY AND DEVELOPMENT ISSUES


How is poverty in India measured?

  • India adopted the Multidimensional poverty index, with some modifications, in 2021. The national MPI is measured now by the NITI Aayog.
  • After India switched to its version of the MPI, poverty data was published for 2015-16 and 2019-21 based on the NFHS data for the corresponding years. 
  • In 2015-16, Bihar was again the only state with more than 50% of the population living in poverty. 
  • In six states, more than a third of the population was poor. The proportion of poor people in eight states and UTs was below 5%.


Who measured Poverty in India?

Poverty in India is measured by the NITI Aayog through the calculation of the poverty line, based on the data collected by the NSSO (National Sample Survey Office).


Poverty In India: Post-Independence Poverty Estimation Methods: 

In 1962, the Planning Commission constituted a working group to estimate poverty nationally, and it formulated separate poverty lines for rural and urban areas – of Rs 20 and Rs 25 per capita per year, respectively.  (Refer to Table for more details.)


Committees Methodology Poverty line
V N Dandekar and N Rath (1971) Consumption Expenditure to provide  2,250 daily calories.  Rural-Rs 15 and 

Urban -Rs 22.5 (per person per day)

Y K Alagh Task Force (1979) Consumption expenditure Rural-2,400 calories

Urban- 2,100 calories (Per day)

Rural- Rs 49.09 

Urban- Rs 56.64 (per person per month)

D T Lakdawala Expert Group’s (1993) Consumption expenditure based on calorie consumption A separate line for each state using regional consumer price indices
Tendulkar Expert Group (2009) A uniform poverty line basket (PLB) across rural and urban India based on  Mixed Reference Period and incorporation of private expenditure on health and education Rural -Rs 446.68 

Urban-Rs 578.80 

(Per capita per month based 2004-05 prices ).

Rangarajan Committee (2014) Revised the Tendulkar poverty line by creating separate consumption baskets for rural and urban areas, Urban-Rs 47 

Rural- Rs 32  

(The daily per capita expenditure based on 2011-12 prices).


The Multidimensional Poverty Index (MPI)

  • In 2010, the United Nations Development Programme and the Oxford Poverty and Human Development Initiative created the Multidimensional Poverty Index (MPI).
  • It measures “acute deprivations in health, education, and living standards that a person faces simultaneously” in addition to income and expenditure levels.
  • It includes outcome-based indicators like malnourishment, school attendance and years of schooling, and access to water, sanitation, electricity and cooking fuel.
  • According to the global MPI, a person is considered poor if they are deprived of a third or more indicators.
Print Friendly, PDF & Email

To get PDF version, Please click on "Print PDF" button.

Print Friendly, PDF & Email

 Final Result – CIVIL SERVICES EXAMINATION, 2023.   Udaan-Prelims Wallah ( Static ) booklets 2024 released both in english and hindi : Download from Here!     Download UPSC Mains 2023 Question Papers PDF  Free Initiative links -1) Download Prahaar 3.0 for Mains Current Affairs PDF both in English and Hindi 2) Daily Main Answer Writing  , 3) Daily Current Affairs , Editorial Analysis and quiz ,  4) PDF Downloads  UPSC Prelims 2023 Trend Analysis cut-off and answer key

THE MOST
LEARNING PLATFORM

Learn From India's Best Faculty


 Final Result – CIVIL SERVICES EXAMINATION, 2023.   Udaan-Prelims Wallah ( Static ) booklets 2024 released both in english and hindi : Download from Here!     Download UPSC Mains 2023 Question Papers PDF  Free Initiative links -1) Download Prahaar 3.0 for Mains Current Affairs PDF both in English and Hindi 2) Daily Main Answer Writing  , 3) Daily Current Affairs , Editorial Analysis and quiz ,  4) PDF Downloads  UPSC Prelims 2023 Trend Analysis cut-off and answer key

Quick Revise Now !
AVAILABLE FOR DOWNLOAD SOON
UDAAN PRELIMS WALLAH
Comprehensive coverage with a concise format
Integration of PYQ within the booklet
Designed as per recent trends of Prelims questions
हिंदी में भी उपलब्ध
Quick Revise Now !
UDAAN PRELIMS WALLAH
Comprehensive coverage with a concise format
Integration of PYQ within the booklet
Designed as per recent trends of Prelims questions
हिंदी में भी उपलब्ध

<div class="new-fform">


    </div>

    Subscribe our Newsletter
    Sign up now for our exclusive newsletter and be the first to know about our latest Initiatives, Quality Content, and much more.
    *Promise! We won't spam you.
    Yes! I want to Subscribe.