Context:
| Relevancy for Prelims: Mumbai Air Pollution, Air Quality Index, World Health Organization (WHO), Economic Policy Reforms 2023, and National Clean Air Programme.
Relevancy for Mains: Mumbai Air Pollution, Mumbai Air Quality, reasons behind increasing air pollution in Mumbai, and Government Initiatives. |
Mumbai Air Pollution
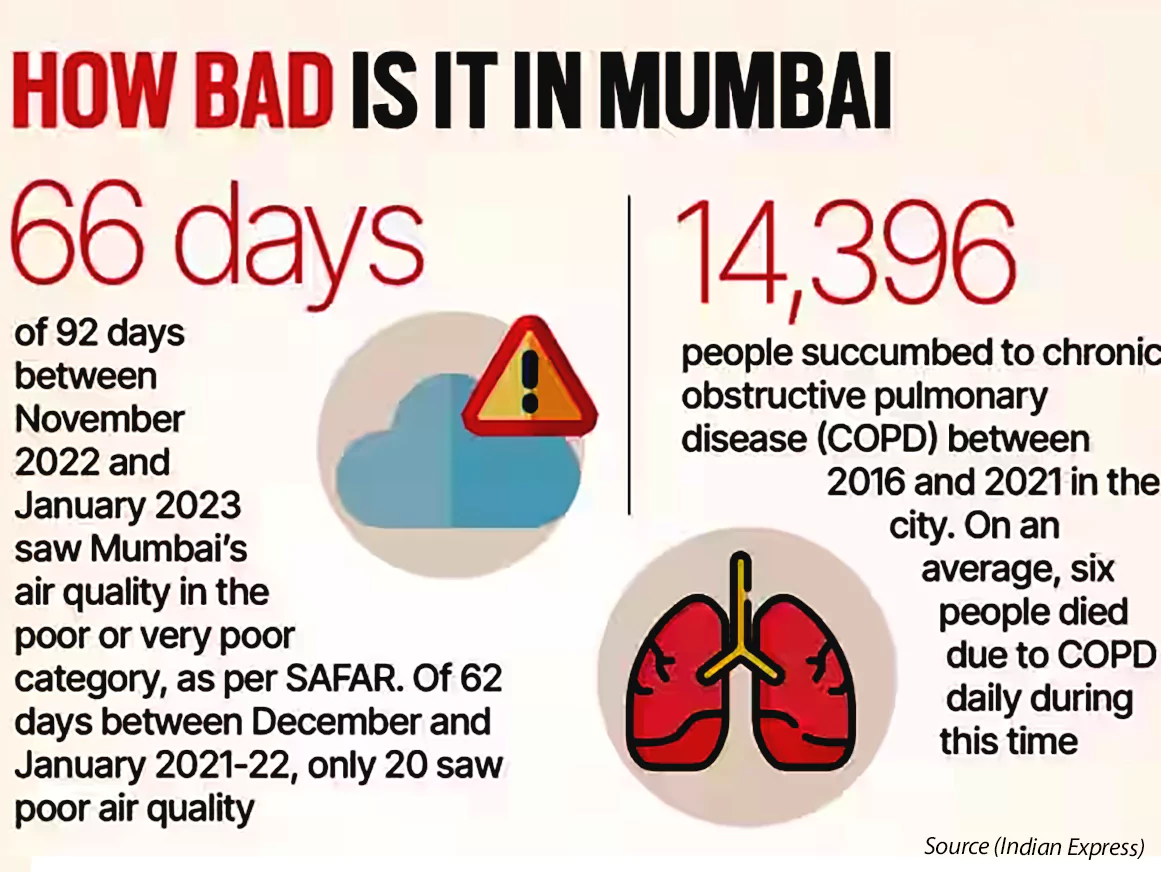
- Worsening air quality index (AQI): It went beyond 300 in some parts of the city.
- An AQI of 200 or above is considered ‘poor’ air quality, while 300 and above signifies ‘very poor’ air.
- According to CSE analysis based on real-time data from the working monitoring stations, the number of bad-air days in Mumbai doubled between 2019 and 2021, while good days were down by 20 percent.
- The concentration of fine particulate matter (PM2.5) in Mumbai was 14.7 times the World Health Organization (WHO) guideline of five micrograms per cubic metre.
What is AQI?
- The AQI is a colour-coded air monitoring and classification tool launched by MoEFCC for effective communication of air quality status to people.
- There are six AQI categories: Good, Satisfactory, Moderate, Poor, Very Poor, and Severe.
- Each of these categories is decided based on the ambient concentration values of air pollutants and their likely health impacts (known as health breakpoints).
|
Also read: Air Quality Life Index (AQLI) Report
What are the reasons behind increasing air pollution in Mumbai?
- Disruption of wind pattern: Mumbai experiences regular wind patterns alternating between sea-to-land and land-to-sea movements every 3-4 days, which naturally clears dust particles.
- However, current poor air quality is caused by frequent and extended disruptions in this wind cycle, with direction changes occurring after eight to ten days.
- As per scientists, this could be due to the prevailing La Nina conditions in the eastern Pacific Ocean.
- La Nina is a condition in which the sea surface temperatures in the eastern Pacific Ocean become cooler than normal.
- Calm winds and temperature gradient: The calm winds due to monsoon retreat coupled with high October temperatures caused winds from hilly areas( Sahyadri) to carry dust to the city.
- Increase in number of sources of pollutants: The increasing air pollution levels in Mumbai are an indicator of a high emission load from industrial hotspots and the worsening transport situation in and around the mega city.

-
- For Example– the Trans-Thane Creek, Taloja, Ambernath and Dombivali are the major industrial clusters surrounding Mumbai. The massive use of coal in them is one of the key factors for the deteriorating air quality.
- Vehicular Pollution: It is the most significant contributor to Mumbai’s air pollution.
- A study conducted by the System of Air Quality Weather Forecasting and Research(SAFAR) shows that the share of vehicular emissions has increased considerably to over 30%, a significant rise from 16% in 2016-17.
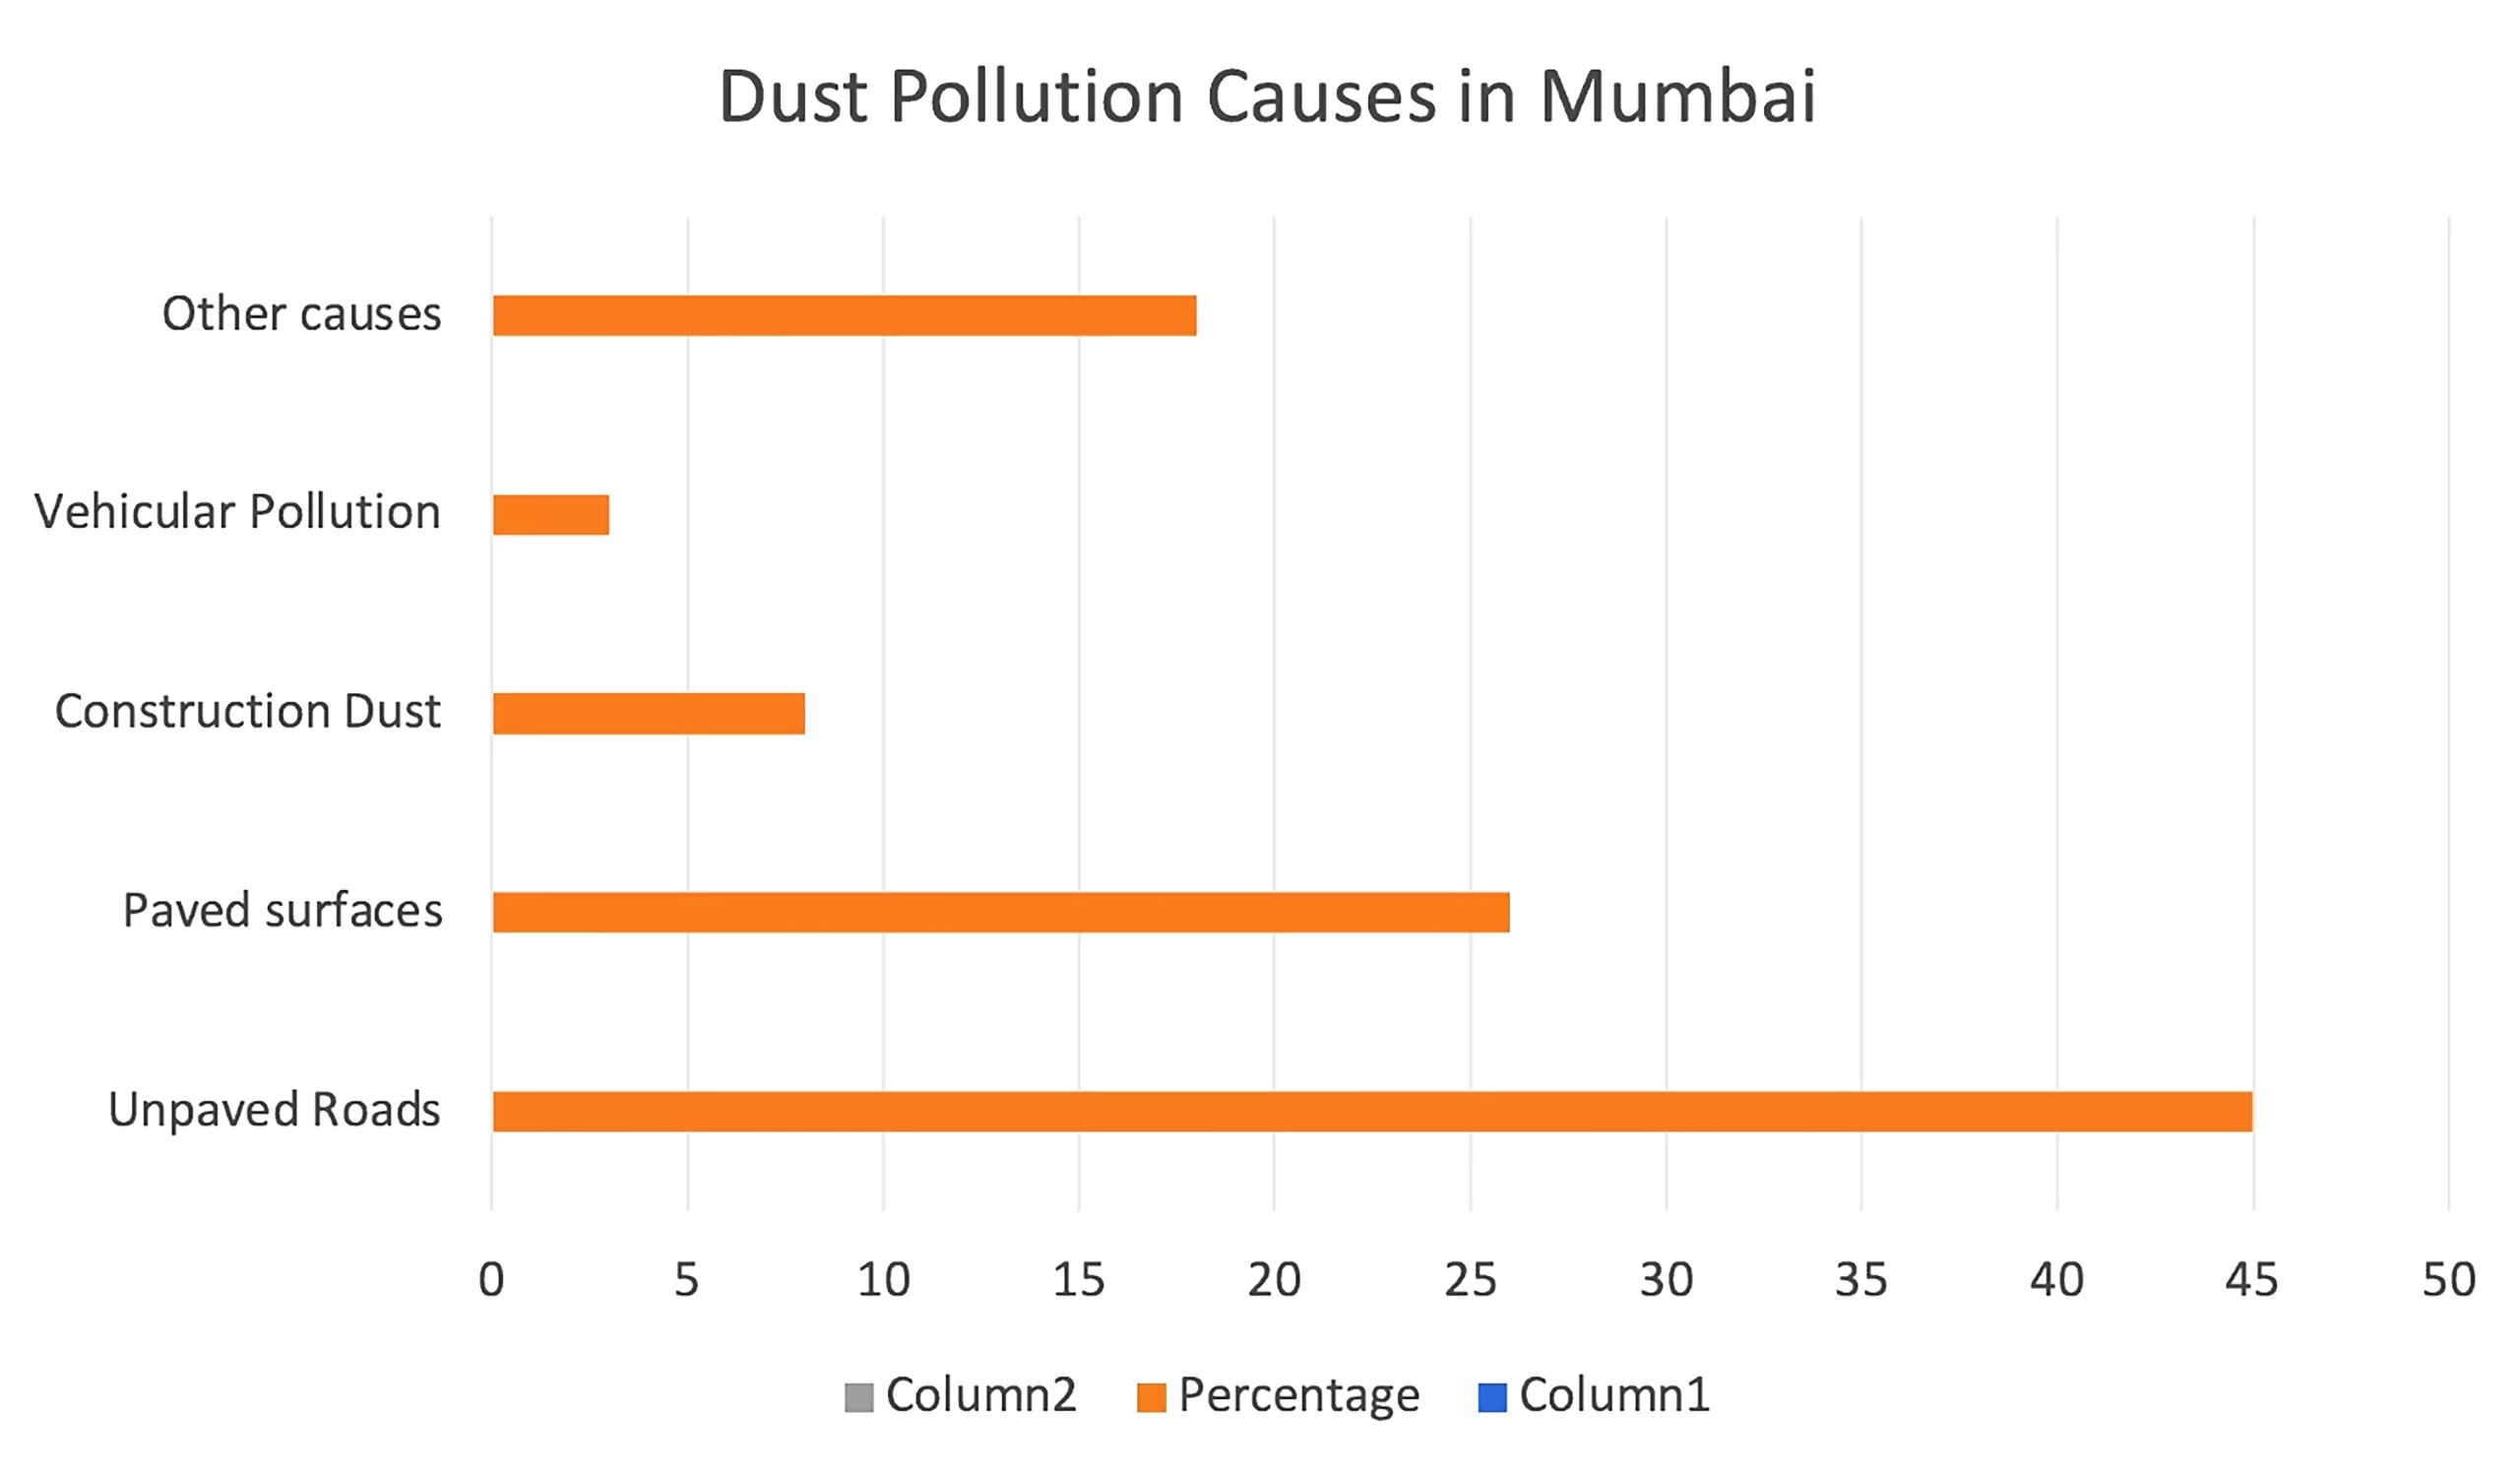
- Increased dust pollution: Mumbai’s long-term air quality decline is driven by increased economic activity, more vehicles, extensive construction, and higher emissions, with no matched mitigation norms.
- Increase in construction activity has resulted in high PM2.5 levels, making it one of the most polluted months in the city’s recent history.

- Increasing deforestation:
- The metro project claimed over 2100 trees in Aarey forest and over 5000 trees across the city.
- Ahmedabad Mumbai bullet train project sought over 125 hectares of forest land from Sanjay Gandhi national park.
- The Tungareshwar sanctuary in Vasai involves reclamation of 40000 mangroves.
What are the challenges with air pollution?
- Premature deaths: As per the Lancet 2022 study, air pollution is estimated to have caused around 1.7 million premature deaths in India in 2019, accounting for nearly 17.8 per cent of the total deaths recorded in the country that year, the highest in the world.
- Loss of DALY: Nearly 40 million disability-adjusted life-years (DALYs), comprising 11.5 per cent of the total DALYs, are lost due to air pollution.
- Decrease in life expectancy: As per a study by the Centre for Science and Environment (CSE), life expectancy in India has decreased by 2.6 years due to the diseases brought on by air pollution.
- Increase in non-communicable diseases: It has emerged as the most significant risk factor for lung cancer, respiratory obstructions, cardiovascular diseases, stroke, and acute respiratory infections, etc.
- Impact of child health: As per new epidemiological studies, it impacts child’s birth weight, development and cognition, insomnia, fertility, cerebral health.
- Economic cost: Air pollution costs about $95 billion annually, i.e., almost 7 lakh crore, forming around 3.3 per cent of India’s total GDP.
- Welfare cost: According to the report ‘Economic Policy Reforms 2023: Going for Growth’, the Ambient particulate matter led to welfare cost of premature deaths at 8.4 per cent of India’s gross domestic product in 2019.
What are the steps taken by the Government to reduce air pollution?
- Clean Air Mumbai initiative: The Brihanmumbai Municipal Corporation (BMC) announced a seven-step action plan to battle air pollution as part of the initiative.
- Installation of artificial lungs: A pair of white artificial lungs were installed in west Mumbai, to create awareness regarding increasing pollution levels and health hazards associated with it.
- Maharashtra Electric Vehicle Policy 2025: Under this, the municipal administration has allocated Rs 99.22 crores towards dust mitigation, Rs 992 crores to public transport electrification.
- Graded Response Action Plan(GRAP): The Maharashtra Government has formulated a GRAP similar to the one planned by the Delhi Government to combat air pollution.
- National Clean Air Programme: It is a national-level strategy to combat rising air pollution by 2024.
What is a Graded Response Action Plan (GRAP)?
- The GRAP is a framework designed to combat air pollution in the Delhi-NCR region.
- It was introduced as an emergency response mechanism, and its implementation is triggered when the AQI reaches “poor” levels.
Implementing agency
- The Commission for Air Quality Management (CAQM) in NCR and adjoining areas oversees the implementation of GRAP.
|
Also read: Winter Action Plan For Delhi Air Pollution
Way Forward
- Implementation of pollution mitigation plans: The authorities just need to implement them with following of simple measures such as sprinkling of water and dust screens.
- Sectoral emission load reduction targets: Government should include them to move towards better air quality levels.
- A holistic, integrated, and comprehensive year-wide action plan to tackle air pollution must be formulated, as being practiced in Delhi-NCR (the GRAP).
- Monitoring system: Install a sensor-based monitoring system that can calculate air quality within a radius of three km around it.
- Various air pollution monitoring mechanisms should be consolidated into one robust and standardised monitoring system.
- Tackling dust pollution: One solution to tackle road dust is to build better roads that do not require revamping.
- Mechanical dust-sweeping machines, using chemical dust suppressants that make the dust particles heavier and prevent them from spreading into the air.
- Fast pacing the drive towards electric vehicles: Indian automobile sector could drive the shift towards electric vehicles and become a world leader in this segment.
- Environmental sustainability, along with economic growth, is a win-win situation.
- Inculcating environment-positive behaviours: Habits like car-pooling, public transport, cycling to work, circular consumption patterns should be ingrained among the people.
Conclusion:
The deteriorating air quality in Mumbai demands urgent action and a comprehensive strategy to address the multifaceted sources of pollution, from vehicular emissions to industrial hotspots, in order to safeguard public health and environmental sustainability.
| Prelims Question (2016)
In the cities of our country, which among the following atmospheric gases are normally considered in calculating the value of Air Quality Index?
1. Carbon dioxide
2. Carbon monoxide
3. Nitrogen dioxide
4. Sulfur dioxide
5. Methane
Select the correct answer using the code given below.
(a) 1, 2 and 3 only
(b) 2, 3 and 4 only
(c) 1, 4 and 5 only
(d) 1, 2, 3, 4 and 5
Ans: (b) |
![]() 25 Oct 2023
25 Oct 2023


