![]() 14 Dec 2023
14 Dec 2023
Graphs are a powerful tool for visually representing the motion of objects, enabling clearer understanding and analysis.
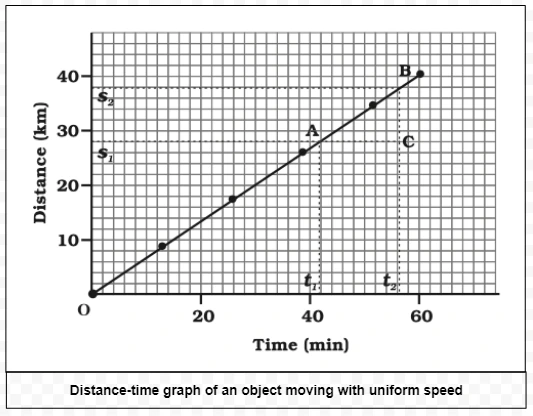
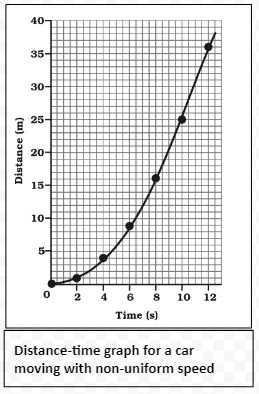
v = s2−s1/t2−t1
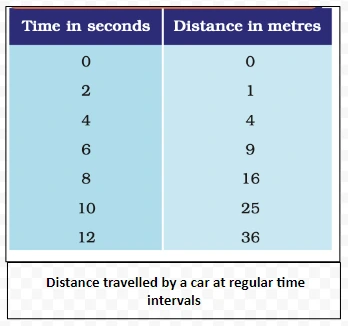
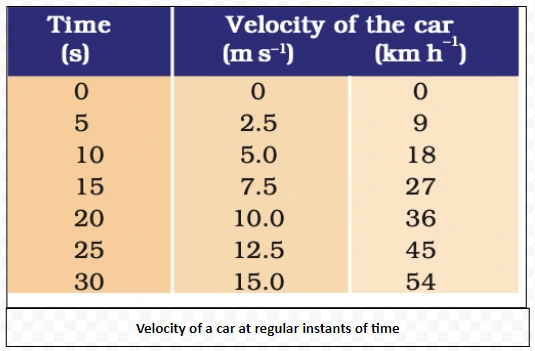
Furthermore, distance-time graphs can also represent accelerated motion. For example, Table 1.1 illustrates distances covered by a car every two seconds, demonstrating an accelerated motion.
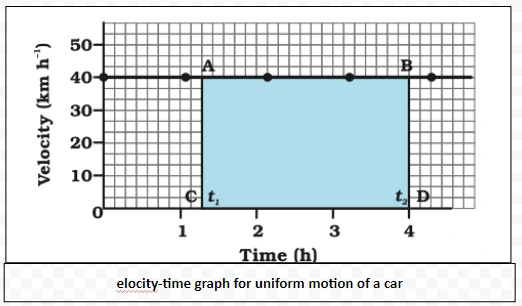
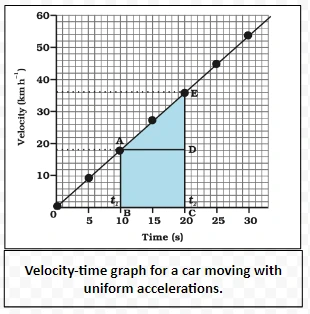
s = AC CD
= [(40 km h-1) (t2−t1)h]
= 40(t2−t1)km. This distance corresponds to the area of the rectangle ABCD.
<div class="new-fform">
</div>