The year 2025 is witnessing a confused El Niño Southern Oscillation (ENSO) state, with warm SST anomalies emerging in the far eastern tropical Pacific and cold SST anomalies in the central-western tropical Pacific.
The Observed Anomalies in 2024
- Non Emergence of La Nina: Cold SST anomalies in the far eastern tropical Pacific Ocean was forecasted at the beginning of 2024 but it began shifting westward, towards the international dateline, with warm SST anomalies appearing in the far east by early summer 2024.
- Cause: It is likely the strong La Niña that was forecast for 2024 failed to emerge due to ENSO transition mode (ETM) induced wind anomalies in the tropical Pacific.
- ENSO here is the El Niño Southern Oscillation, which encompasses the warm state of an El Niño and the cold state of a La Niña.
- The unusual pattern of cold SST anomalies to the west of warm SST anomalies in the far east have persisted to date.
- Dateline El Niño or a Central Pacific El Niño: In the last few decades, the reverse pattern, with warm SST anomalies around the dateline and cold SST anomalies around the Galapagos has been more common.
- El Niño “flavours”: It is an anomalous situation where the El Niños can have warm SST anomalies in the east or central Pacific which is a dominant pattern of La- nina (cold SST anomalies in the far eastern to central tropical Pacific).
- Anomalies in Wind Patterns: Strong easterly anomalies blew in the central-western tropical Pacific even as there were westerly anomalies in the far eastern tropical Pacific.
About Sea Surface Temperature (SST) Anomalies
- Sea Surface Temperature (SST) Anomalies are simply transient events, deviations from the long-term average SST, indicating whether an area’s ocean temperature is warmer or cooler than usual
- Positive Anomalies: It signify warmer-than-average temperatures
- Negative Anomalies: It indicates cooler-than-average conditions.
- El Niño Southern Oscillation (ENSO): At irregular intervals (roughly every 3-6 years), the sea surface temperatures (SST)in the Pacific Ocean along the equator become warmer or cooler than normal.
- These anomalies are the hallmark of El Niño and La Niña climate cycles, which can influence weather patterns across the globe.
 Measurement: SST anomalies are calculated by comparing the current sea surface temperature to a long-term average or baseline.
 -
- Commonly used climatologies include the 1991-2020 period.
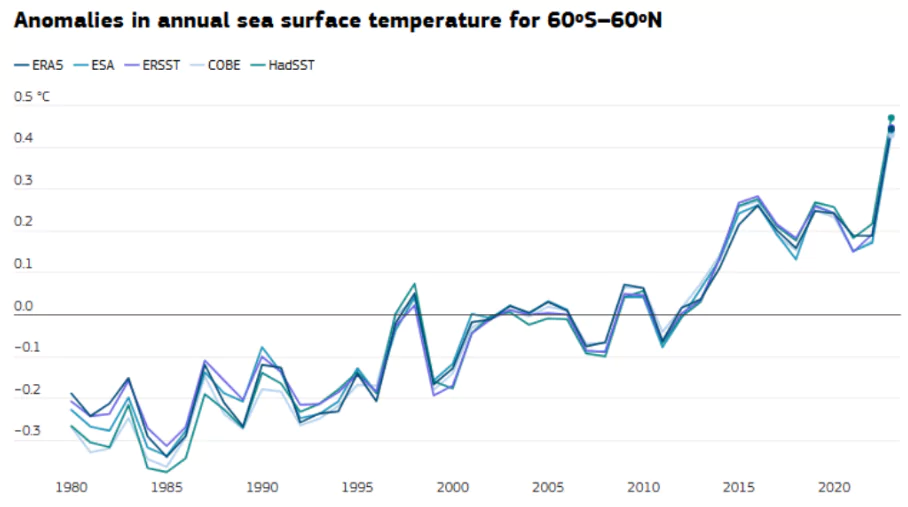
- Sea Surface Temperature Range: Between the late 19th century (1880–1900) and the last five years (2019–2023), the average SST over the extrapolar ocean (60°S–60°N) has increased by about 0.9°C. The increase from 1980 to 2023 has been around 0.6°C.
- Warming Oceans: Parts of the Arctic Ocean, including the Barents and Kara Seas, the Baltic Sea, the Black Sea and parts of the extra-tropical Pacific, such as the North Pacific are amongst the fastest warming areas.
- Exception: The North Atlantic, to the south of Greenland and Iceland remains one of the few areas globally to have cooled on those timescale.
Importance of the Study of SST Anomalies
- Climate Variability and Predictability: SST anomalies are a key driver of tropical climate variability, including phenomena like El Niño-Southern Oscillation (ENSO).
- Weather Forecasting: SST anomalies provide valuable information for long-range weather forecasts, especially for subseasonal and seasonal predictions.
- Atmospheric Circulation: SST anomalies also influence atmospheric circulation patterns which can lead to changes in wind patterns and weather systems.
- Variable Rainfall Patterns: SST anomalies does affect rainfall patterns, with positive anomalies (warmer temperatures) resulting in floods in some areas and droughts in others.
- Extreme Weather Events: SST anomalies can also be the source of extreme weather events, such as hurricanes and cyclones, as they provide the necessary energy for these systems to intensify.
- Ocean-Atmosphere Interactions: SST is the boundary between the ocean and atmosphere, and understanding SST anomalies helps us understand the complex interactions between these two systems, including energy, momentum, and gas exchange.
- Marine Heatwaves and Ocean Features: SST anomalies can also be used to monitor marine heatwaves, ocean fronts, and regions of upwelling, which are important for understanding ocean ecosystems and their response to climate changes.
Sea Surface Temperature (SST)
- Sea Surface Temperature (SST) refers to the temperature of the ocean’s uppermost layer, typically the top few meters, which is in direct contact with the atmosphere.
- OMT vs SST: The Ocean Mean Temperature (OMT) measures ocean temperature upto a depth of 26o isotherm which is the top 50-100 meters of ocean surface.
- SST varies with latitude, with the warmest waters generally near the equator and the coldest waters in the Arctic and Antarctic regions.
- Measurement: SST is measured using various methods, including sensors on satellites, buoys, ships, and ocean reference stations.
- Examples: Surface temperature and vegetation data from the Advanced High Resolution Radiometer (AVHRR) on board NOAA POES satelittes, the Moderate Resolution Imaging Spectroradiometer aboard NASA’s Terra and Aqua satellites.
- Importance:
- SST patterns influence key elements of the climate system, such as atmospheric circulation, rainfall patterns and intensity and frequency of tropical cyclones.
- SSTs are important for climate monitoring as the top few metres of the ocean can hold as much energy as the entire atmosphere.
- SST is also important for forecasting at a range of timescales, from hours to years ahead as they also form a key part of the datasets used to estimate global temperature change.
- Marine heatwaves, ocean fronts and regions of upwelling can all be monitored using measurements of SST.
- Causes of SST Rise:
- Global Warming: Increased concentrations of greenhouse gases in the atmosphere trap heat, leading to a rise in global temperatures, including ocean temperatures.
- Ocean Heat Absorption: The increased heat due to increased emissions are being absorbed majorly by oceans leading to a rise in SST.
- Ocean Acidification: Oceans act as carbon sinks, absorbing a large portion of human-emitted CO2, which can lead to acidification and warming of surface waters.
- Albedo Effect: The melting of polar ice reduces the Earth’s reflective surface (albedo), allowing more sunlight to be absorbed by ocean waters.
|
Additional Link: About EL Nino and La Nina


 20 Mar 2025


.png)


 Current Affairs


 GS Foundation
 Optional Course
 Combo Courses
 Degree Program