Despite India’s Gini Index of 25.5 ranking it as the fourth most equal country, deep inequalities persist in everyday life across urban and rural areas.
About Gini Index
- The Gini Index measures how much the distribution of income or consumption deviates from perfect equality.
- Origin: The Gini index, or Gini coefficient, was developed in 1912 by Italian statistician Corrado Gini.
- Purpose: It measures how income, wealth, or consumption is distributed among individuals or households in a country. It reflects the degree of inequality, not the absolute levels of income or wealth.
- Range: It ranges from 0 to 100:
- 0 = perfect equality (everyone has the same income)
- 100 = absolute inequality (one person has everything, others have nothing)
- Indicator: The higher the Gini Index, the more unequal a country is.
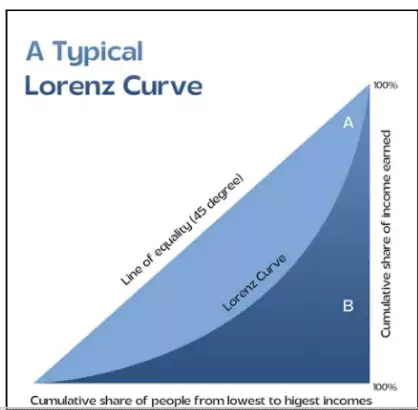
- Visualization: The Gini Index is often illustrated using the Lorenz Curve:
- The diagonal line represents perfect equality.
- The Lorenz Curve shows actual income distribution.
- The Gini Index measures the gap between the two curves as a percentage of the total area under the diagonal.
- Interpretation: A larger gap between the Lorenz curve and the line of equality means greater inequality.
- Critique: The Gini Index fails to capture the true extent of inequality in India, as it overlooks various forms of inequality beyond income.
Forms of Inequality in India
- Wealth Inequality
- The Gini Index cannot fully account for wealth inequality, which is more severe.
- Example: Urban India’s stark wealth divide is reflected in luxury cars juxtaposed with low-income jobs in the informal sector.
- In 2022-23, the top 1% of India’s population held 22.6% of the national income.
- The informal sector contributes to data gaps, as less than 10% of the population is formally taxed, illustrating wealth disparity.
- Gender Inequality
- Labor Force Participation: Women comprise only 35.9% of India’s workforce.
- Leadership Roles: Only 12.7% of women hold leadership roles in the corporate sector as of 2024.
- Startup Ecosystem: Women-run startups account for just 7.5% of active startups.
- Cultural and Social Norms: Gender inequality is aggravated by biases in resource allocation for education and inheritance practices.
- Digital Inequality
- Access to Technology: India has made significant strides in internet access, but the digital divide persists, especially in rural areas.
- Schools with Functional Technology: Only 52.7% of schools have functional computers, and 53.9% have internet access.
- Educational Inequality: The lack of digital infrastructure in schools exacerbates the educational divide, limiting technology access for rural students.
Digital Divide and Education
- Impact on Rural and Urban Students: Access to digital technology is crucial for modern education and job opportunities.
- Only 41.8% of households have broadband access, deepening educational inequality.
- When schools shut due to air pollution (e.g., in New Delhi), only students from digitally equipped households can continue learning.
- Gender and Digital Divide:
- In rural areas, only 25% of women have internet access, compared to 49% of men.
- This digital gap hinders women’s access to financial independence, employment, and education.
Interconnections Between Inequalities
- Cumulative Impact: Digital inequality exacerbates existing gender, economic, and social inequalities.
- Women’s Digital Divide: Lack of internet access disables women from accessing essential opportunities, including online banking, jobs, and education.
Conclusion
The Gini Index’s methodology does not capture the complexity of inequality in India, where digital, gender, wealth, and educational divides are rampant. India needs to address these inequalities through policy reforms, inclusive economic growth, and equitable access to resources for all sectors of society.
Additional Readings: Measuring Inequality in India


 30 Jul 2025


.png)


 Current Affairs


 GS Foundation
 Optional Course
 Combo Courses
 Degree Program