Income inequality in India improved in 2022-23 after worsening during the Covid-19 pandemic (2020-21), reflecting the impact of effective post-pandemic recovery measures.
- A working paper by the People Research on India’s Consumer Economy (PRICE) highlighted persistent wealth concentration among the top income earners despite overall improvements in inequality.
Key Findings on Inequality
- The Gini index, a measure of income inequality:
- Improved from 0.463 post-independence to 0.367 in 2015-16.
- Worsened to 0.506 in 2020-21 due to pandemic disruptions.
- Improved to 0.410 in 2022-23, indicating reduced disparities.
- Income distribution trends (2022-23):
- Top 10%: Income share declined to 30.6% from 38.6% in 2020-21.
- Bottom 50%: Share increased to 22.82%, up from 15.84% in 2020-21.
- Middle 40%: Share rose to 46.6%, compared to 43.9% in 2020-21.
- The top 1% peaked at a 9.0% income share in 2020-21, which declined to 7.3% in 2022-23.
Enroll now for UPSC Online Course
About Lorenz Curve and Gini Coefficient
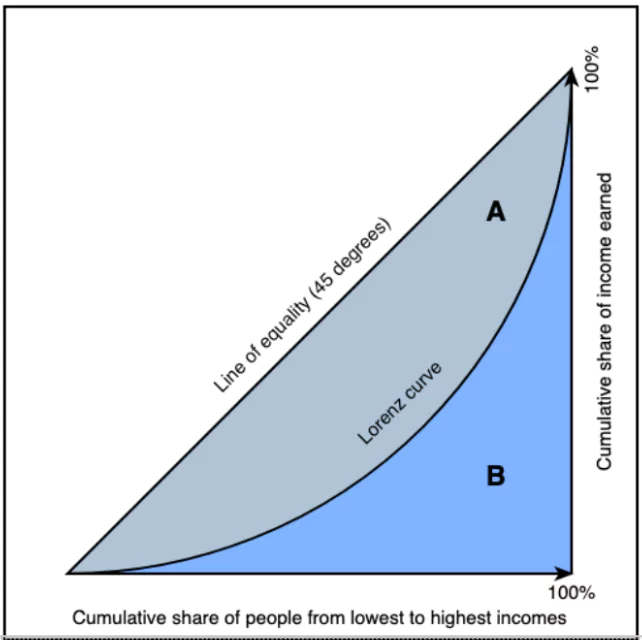
- The Lorenz Curve is a graphical representation used to visualize the distribution of income or wealth within a population.
- It compares the actual distribution of income or wealth with an ideal situation of perfect equality.
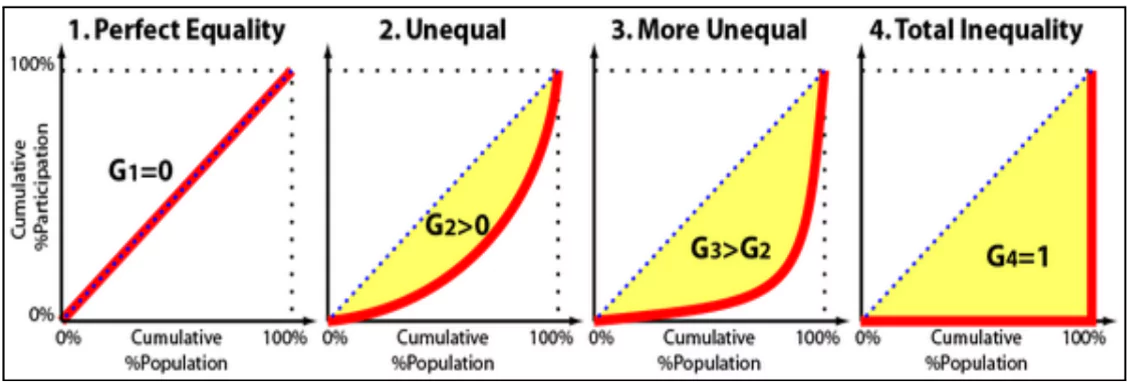
- Line of perfect Inequality: In the case of perfect equality, the Lorenz Curve would be a straight line at a 45-degree angle.
- If there is income inequality, the Lorenz Curve bends away from the line of perfect equality.
About Gini Coefficient

- The Gini Coefficient assigns a numerical value between 0 and 1 to measure income or wealth inequality.
- A Gini Coefficient of 0 represents perfect equality, where everyone has the same income or wealth.
- A Gini Coefficient of 1 signifies perfect inequality, where one person or household has all the income or wealth, and everyone else has none.
- The Gini Coefficient is calculated by comparing the area between the Lorenz Curve and the line of perfect equality.
- Gini Coefficient = A/(A+B)
- Lorenz Curve helps visualize the distribution of income or wealth.
- The Gini Coefficient provides a precise measure of the degree of inequality.

Factors of Inequality
- Pandemic Impact:
- Job losses and economic instability disproportionately affected the bottom 50%.
- Sectors like technology and e-commerce flourished, boosting the wealth of the top income earners.
- Structural Barriers:
- Limited access to quality education, healthcare, and infrastructure, especially in rural areas.
- Concentration of wealth among top earners reflects entrenched economic disparities.
Check Out UPSC CSE Books From PW Store
Government Initiatives to Address Inequality
- Social Welfare Schemes: Government has launched several schemes targeting the Inequality Issues such as:
- MGNREGA: Ensures employment for rural households, reducing income disparities.
- Direct Benefit Transfer (DBT): Delivers subsidies and benefits directly to beneficiaries.
- Financial Inclusion:
- JAM Trinity: Combines Jan Dhan accounts, Aadhaar, and mobile technology to improve access to financial services.
- Pradhan Mantri Jan Dhan Yojana: Provides bank accounts to economically weaker sections.
- Social Security Net:
- Pradhan Mantri Suraksha Bima Yojana: Offers accident insurance to the underserved.
- Atal Pension Yojana: Secures income for workers in the unorganized sector.
- Pradhan Mantri Jeevan Jyoti Yojana: Provides life insurance for low-income groups.
- Employment and Skill Development:
- Skill India Mission: Focuses on enhancing employability through vocational training.
- MUDRA Bank: Offers microfinance to rural entrepreneurs.
- National Hub for SC/ST Entrepreneurs: Supports entrepreneurship among marginalized communities.
- Focus on Social Infrastructure: As per the Economic Survey (2017-18), the government prioritizes education, health, and social protection to ensure inclusive growth.
Challenges in Tackling Inequality
- Entrenched Wealth Concentration: The top 10% still hold a significant share of national income, highlighting the need for redistributive measures.
- Slow Recovery for Vulnerable Groups: The bottom 10% remain far behind, with their income share recovering only marginally post-pandemic.
- Policy Implementation Gaps: Inefficiencies in delivering benefits of social programs reduce their impact on inequality.
- Economic Shocks: External disruptions like pandemics and economic downturns exacerbate existing disparities.
Enroll now for UPSC Online Classes
Way Forward
- Strengthening Social Safety Nets: Expand coverage and efficiency of welfare schemes to benefit the most vulnerable.
- Progressive Taxation: Implement equitable tax policies such as Wealth Tax to reduce wealth concentration.
- Investment in Rural Development: Prioritize education, healthcare, and infrastructure in rural and marginalized areas.
- Inclusive Growth Strategies: Ensure economic growth benefits all segments through targeted reforms and equitable policies.
- Vigilance and Adaptive Policies: Regularly assess inequality trends and update policies to address emerging challenges.
![]() 6 Jan 2025
6 Jan 2025


