Context:
The India Human Development Survey (IHDS):
- It is a nationally representative, multi-topic panel survey of 41,554 households in 1503 villages and 971 urban neighborhoods across India.
- Unlike single-topic surveys, the IHDS collects data on different dimensions of human development like education, caste, gender relations and infrastructure.
|
The Evolving Discourse on Economic & Social Inequality in India
- Shifting Narrative on Social Inequality: Over the past two decades, the narrative on Social inequality has shifted considerably as new data sets and innovative estimation techniques have forced a re-appraisal of economic inequality in the country.
- India Human Development Survey (IHDS): The two IHDS rounds conducted in 2004-05 and 2011-12 provided nationally representative income distribution estimates. They showed that consumption inequality was in line with the official estimates, and comparable to developing country peers, but income inequality in India was higher than in most parts of the world.
Exploring the Dimensions of Social Inequality in Modern Society
- Social Inequality is the uneven distribution of resources or opportunities among individuals or groups. It can be measured in several ways, including income inequality, wealth inequality, and inequality of access to education, healthcare, and other essential services.
Beyond the Divide: Navigating Distinctions Between Social Inequality and Poverty
| Feature |
Inequality |
Poverty |
| Focus |
Distribution of resources or opportunities |
Absolute or relative lack of resources |
| Measurement |
Income inequality, wealth inequality, Gender Inequality, etc. |
Poverty line Eg. Tendulkar, Rangrajan
World Bank Poverty Line. |
| Impact |
Social unrest, political instability, economic stagnation |
Hunger, malnutrition, disease, illiteracy |
| Solutions |
Redistribution of resources, progressive taxation, investment in education and healthcare |
Social safety nets, targeted poverty reduction programs, economic development |
Types of Inequality: Different kinds of inequalities in India are multidimensional and intersectional in nature manifest in various forms, encompassing economic, social, and political dimensions.
- Economic Inequality: Economic inequality refers to the uneven distribution of economic resources and opportunities among individuals or groups within a society. It encompasses two main aspects:
- Income inequality refers to the disparity in income levels among individuals or groups.
- Wealth inequality: This refers to the uneven distribution of assets, such as property, investments, and savings, among individuals or groups.
- Social Inequality: Social inequality refers to the unequal distribution of social status, power, and privileges among individuals or groups based on factors like caste, gender, race, ethnicity, religion, and sexual orientation. It manifests in various forms, including:
- Caste inequality: This refers to the hierarchical social stratification based on caste, a social system prevalent in some societies, where individuals are assigned to a specific caste at birth, determining their social status, opportunities, and access to resources.
- Gender inequality: This refers to the unequal treatment and opportunities experienced by men and women in various aspects of life, including employment, education, healthcare, political participation, and decision-making.
- Political Inequality: It refers to the unequal distribution of political power and influence among individuals or groups within a society. It can manifest in different forms, including:
- Regional inequality: This refers to the uneven distribution of resources, development, and political representation across different regions within a country.
- Limited political participation: It refers to a situation when certain groups face barriers to voting, running for office, or participating in political processes.
|
| Measuring Social Inequality: Tools and Techniques Shaping Social Dynamics in India:
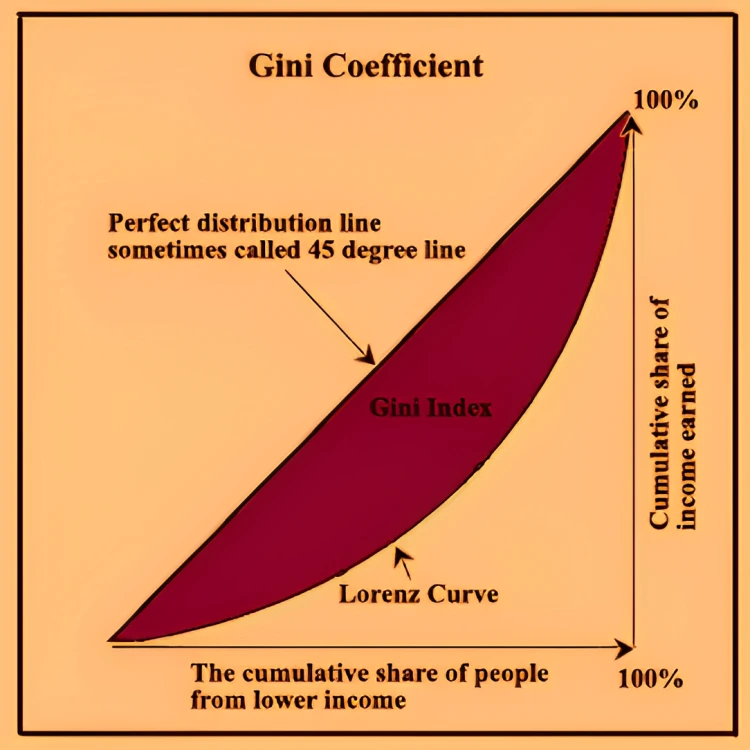
- Lorenz Curve: It plots the cumulative percentage of income against the cumulative percentage of the population. The Lorenz curve would coincide with the 45-degree line if income were perfectly equal. The further the Lorenz curve deviates from the line, the greater the inequality.
- Gini Coefficient: The Gini coefficient is a numerical measure of income inequality based on the Lorenz curve. It ranges from 0 (perfect equality) to 1 (perfect inequality). A higher Gini coefficient indicates a higher level of income inequality.
- Census: The Census of India is a decennial nationwide survey that collects data on various demographic, social, and economic indicators, including income and expenditure. The Census is a valuable source of information on inequality in India, but its data is not as detailed or timely as other sources.
- All-India Household Consumer Expenditure Survey: It is conducted by the National Statistical Office (NSO) that is designed to collect information on the consumption spending patterns of households across the country, both urban and rural.
- NHFS Survey: The National Health and Family Survey (NHFS) is a large-scale survey conducted by India’s Ministry of Health and Family Welfare. The NHFS collects data on a wide range of health and demographic indicators, including income and expenditure. The NHFS is a valuable source of information on inequality in India, particularly for health outcomes.
- PLFS Survey: The Periodic Labour Force Survey (PLFS) is a quarterly survey conducted by India’s Ministry of Labour and Employment. The PLFS collects data on employment, unemployment, and wages. The PLFS is a valuable source of information on inequality in India, particularly for labor market outcomes.
|
Wealth Disparities: Oxfam’s Insight into India’s Social Inequality Landscape
- Oxfam India’s report (“Survival of the Richest: The India story”) on Social inequality in India (Published in January 2023):
- Key Findings:
- Economic Inequality: It finds that 5 percent of Indians own more than 60 percent of the country’s wealth. In comparison, the bottom 50 percent of the population possess only 3 percent of the wealth.
- Income inequality:It further finds between 2012 and 2021, 40 percent of the wealth created in India has gone to just 1 percent of the population and only a mere 3 percent of the wealth has gone to the bottom 50 percent, adding that the total number of billionaires in India increased from 102 in 2020 to 166 billionaires in 2022.
- Wealth Concentration: The combined wealth of India’s 100 richest has touched $660 billion (Rs 54.12 lakh crore) — an amount that could fund the entire Union Budget for more than 18 months.
Challenges in Measuring Inequality in India
- Challenges with Measuring Economic Inequality:
- Lack of comprehensive Income data: India does not have a comprehensive income distribution survey, making it difficult to assess income inequality levels accurately. Instead, economists rely on household consumption expenditure surveys, which provide insights into spending patterns but may not fully capture income disparities.
- The data on household consumption expenditure collected by National Sample Survey Office (NSSO) is among the prominent proxy measures used to capture economic inequality, however data is held by the government citing quality issues in June 2019.
- Informal economy: India has a large informal economy, where many people work without formal employment contracts or records. This makes it difficult to measure income levels in the informal sector accurately.
- Underreporting income can lead to underestimating true income inequality levels.
- Challenges with Measuring Social Inequality:
- Sensitivity of caste data: The public discourse on the caste census has focused largely on its electoral implications and there is a reluctance to provide accurate caste information in surveys.
- Also, the 2011 socio economic caste census failed to produce jati-wise details because of inadequate preparatory work.
- Resistance to caste-based census: Forward castes fear that the ambit of caste quotas may be enlarged. Upper segments of Other Backward Classes (OBCs) fear socioeconomic data on subcastes will expose the wide chasm between them and lower OBCs.
- Some forward caste groups, which want to be included in the list of OBCs, fear that such data might undermine their claims of backwardness.
- Measuring intersectionality: Social inequality often intersects with other factors such as gender, religion, and ethnicity. Measuring these complex interactions can be challenging.
 Challenges with Measuring Political Inequality:
-
- Subjective assessments: Assessing political influence and power can be subjective, making it difficult to quantify political inequality accurately.
- Changing dynamics: The political landscape in India is constantly evolving, making it challenging to track changes in political inequality over time.
Roots of Disparity: The Complex Web of Social Inequality in India
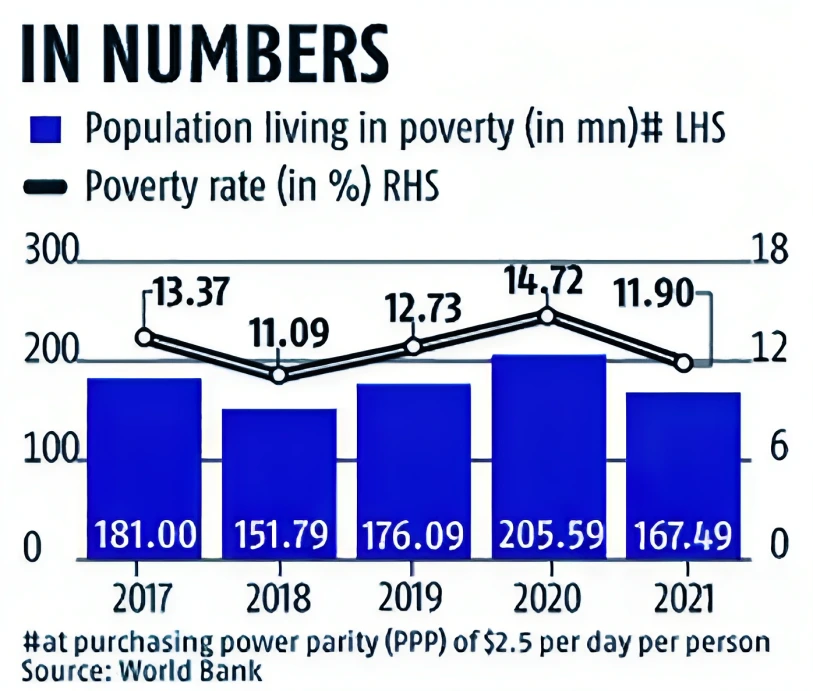
- Poverty and Lack of Resources: One of the main reasons for Social inequality in India is poverty and lack of resources. This prevents them from participating fully in the economy and improving their lives.
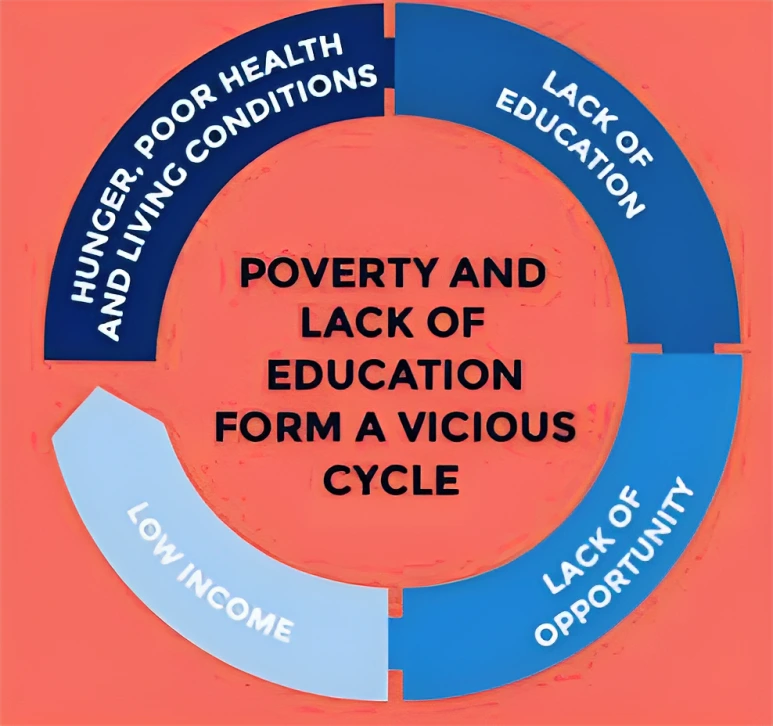 Education and Health: Education and health are essential for economic and social mobility, but access to these services is unequal in India. This Social inequality in education and health perpetuates the cycle of poverty.
- The All India Survey of Higher Education (AISHE) 2020-21 showed that the gross enrollment ratio (GER) for higher education in India was 27.1%, but this varied significantly by socioeconomic status.
- For example: the proportion of SC students is 14.2% and the proportion of OBC students is 35.8% in 2020-21.
- Lack of Employment Opportunities: The lack of employment opportunities disproportionately affects the poor and marginalized groups, further exacerbating their disadvantaged position. The inability to secure a decent job limits their ability to earn a living, access essential services, and improve their quality of life.
- India has an unemployment, quality of jobs and quality of income challenge. Unemployment in India stood at 8.1% in February 2022, as per Centre for Monitoring Indian Economy (CMIE) data.
- Social Structures and Hierarchies: Caste, religion, and gender have long shaped India’s social stratification. These structures shape Indian society’s opportunities and outcomes. Lower castes face discrimination in school, employment, and marriage. Discrimination maintains their social disadvantage.
- A study by the Pew Research Center found that 64% of Indians believe that caste discrimination is a major problem in the country (Pew Research Center, 2022).
- Gender inequality and patriarchal norms:. Women face discrimination in education, employment, and social participation, limiting their economic opportunities and perpetuating their marginalized position.
- Global Gender Gap Report: India has ranked at 127 out of 146 countries in terms of gender parity — an improvement of eight places from last year.
- Regressive Taxation System: There is a fundamental problem with India’s current tax system. India simultaneously has a tax base for direct taxes that is too small and a tax base for indirect taxes that is too large.
- For Example: The corporate tax to GDP ratio stood at 3.1 per cent whereas GST collections were at 6.6 per cent of GDP in 2022-23.
- Malgovernance and Corruption: Corruption is a major problem in India, contributing to Social inequality in several ways. For example, corrupt officials can divert resources from the poor and into their own pockets. They can also use their power to favor certain groups of people over others.
- Transparency International’s Corruption Perception Index ranked India 86th out of 180 countries in 2022, indicating a significant level of perceived corruption
- The Comptroller and Auditor General of India (CAG) reported that the central government’s budget utilization rate was only 78.7% in 2022-23 (CAG, 2023).
Way Forward: A Comprehensive Framework for Tackling Multidimensional Inequality in India
- The Multidimensional inequality Concept: A new approach focuses on the interrelationship between variables like income, labor, education, health and household conditions to emphasize the degree of deprivation.
- Income deprivation can increase the probability of descent into poverty, a multidimensional understanding is important to assess the degree of deprivation in terms of the lack of basic necessities, such as quality education and healthcare, which can improve living standards (The State of Inequality in India Report-2022).
Government Measures to Reduce Social Inequality in India
- Women Reservation Act-2023: Reserve1/3rd seats in Lok Sabha and legislative assembly.
- Mahatma Gandhi National Rural Employment Guarantee Act (MGNREGA)
- a rural employment guarantee scheme that provides at least 100 days of guaranteed wage employment in a year to every adult member of a rural household.
- This scheme aims to mitigate poverty, create employment opportunities, and enhance social security in rural areas.
- National Food Security Act, (NFSA) 2013
- The Act legally entitled up to 75% of the rural population and 50% of the urban population to receive subsidized food grains under Targeted Public Distribution system.
|
- Official database: Officials from the Ministry of Statistics and Programme Implementation, Reserve Bank of India and the income tax department must work together to create a new income and wealth distribution database.
- Moni Mukherjee (Statician) paired consumption data from surveys with savings data from the Reserve Bank of India (RBI) to estimate decile-wise income shares. Such efforts need to be revived.
- Socio Economic Caste Census: Integrating the census with statistical functions will improve its quality and policymaking. Detailed case studies and representative state-wise surveys of caste groups can uncover facets of the caste system that a short census questionnaire is unlikely to reveal.
- The census office roped in independent scholars to conduct village-level case studies documenting rural India’s changing caste relations and mobility profiles.
- Progressive taxation:
- Wealth Tax: In 2020, the Economist S Subramanian estimated that a tax of just 4 percent on the estimated wealth of the top 953 richest families (based on the Hurun India wealth list for 2019) would yield the equivalent 1 percent of GDP in additional taxes more than three times the central government’s health expenditure.
 Property Tax:
- Currently, India barely relies on property taxes, with a property tax to gross domestic product (GDP) ratio of 0.2%. By comparison, the average property tax to GDP ratio for OECD countries is almost 2%.
- Welfare Schemes: Raising minimum income, introducing a universal basic income scheme, Universal Health care system and an urban equivalent of the MGNREGS, allocating of a higher percentage of expenditure towards social services, equitable access to education, and creating more jobs with long-term growth will help to bridge inequality gaps.
- Reforms to the economy’s structure could further support efforts to reduce social inequality by reducing adjustment costs, minimizing regional disparities, and preparing workers to fill a growing number of green jobs.
- Geographically targeted policies and investments can complement existing social transfers.
Conclusion:
Measuring inequality accurately and comprehensively is essential for designing effective policies and interventions to address it. The emphasis on the interaction between social and economic aspects of inequality helps us holistically drive policy action through social protection frameworks.
 22 Nov 2023