India is projected to become the world’s fourth-largest economy in 2025 by nominal GDP, surpassing Japan, according to IMF estimates.
Current Status of Indian Economy
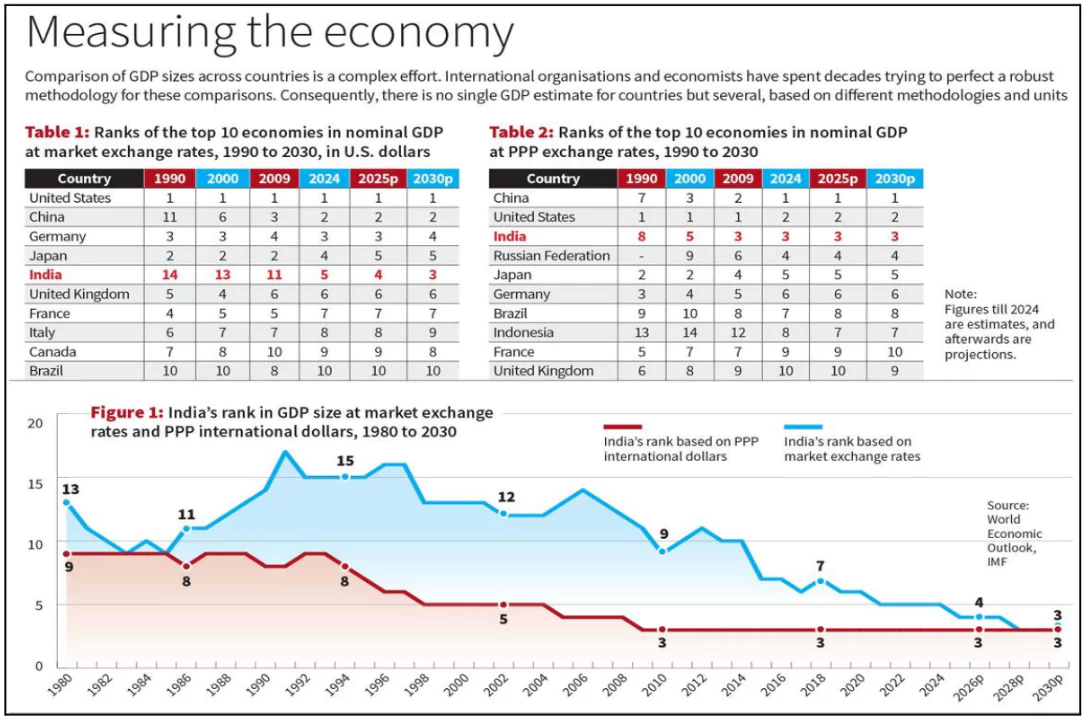
- According to the International Monetary Fund (IMF), India’s nominal Gross Domestic Product (GDP) in 2025 is estimated at $4,187.03 billion, marginally higher than Japan’s GDP.
- By market exchange rate (MER) GDP, India is now the fourth largest economy, behind the United States, China, and Germany.
- The per capita GDP in India was $2,711 in 2024 in current dollar terms, which placed it at the lower end of the list of “lower middle-income countries”.
Market Exchange Rate (MER) Vs Purchasing Power Parity (PPP)
| Aspect |
GDP @ Market Exchange Rate (MER) |
GDP @ Purchasing Power Parity (PPP) |
| Definition |
GDP converted into U.S. dollars using current market exchange rates. |
GDP adjusted based on relative domestic price levels for a common basket of goods/services. |
| Purpose |
Useful for assessing international trade flows, investment, and foreign reserves. |
Provides a more realistic comparison of domestic living standards and consumption capacity. |
| Sensitivity |
Highly volatile; influenced by short-term currency fluctuations and financial markets. |
More stable over time; reflects real cost-of-living differences and domestic price levels. |
| Example |
MER does not reflect price gaps for commodities or services in different economies. |
PPP captures the price difference, showing higher real value of Indian currency domestically.
A Big Mac costs $12 in New York and ₹385 (~$4.50) in Mumbai |
| India’s Rank (2025) |
4th largest economy in the world. |
3rd largest economy since 2009. |
| India’s GDP (2025) |
Approx. $4.19 trillion. |
Approx. $15 trillion. |
| Misinterpretation Risk |
May overstate or understate economic strength based on short-term currency movements. |
May inflate GDP size in poorer countries due to low wages and price levels. |
| Policy Relevance |
Commonly used in financial markets, investor decisions, and budgetary planning. |
More relevant for long-term development analysis, poverty estimation, and global comparisons. |
India’s Target Under ‘Viksit Bharat’
- Vision: To become a developed, high-income country by 2047, aligning with India’s centenary of independence.
Challenges with India’s Growth Story
- Misleading Narratives: GDP based on MER overemphasizes rankings without considering real domestic well-being.
- Low Per Capita Income: Per Capita GDP in India (2024):
- $2,711 (MER), ranking 144th out of 196 countries.
- PPP-based per capita GDP rank is 127th.
- India lags behind Sri Lanka ($4,325) and Vietnam ($4,536) in Per capita GDP (MER) despite being a larger economy overall.
- Informal sector : GDP growth has not been accompanied by a proportionate rise in employment quality or income security.
- The large informal sector and unpaid female labour remain outside formal GDP calculations.
- 76% of casual workers in agriculture and 70% in construction earn below minimum wages (ILO, 2024).
- Sectoral Disparities and Underperformance: Non-traded sectors like health, education, and housing are underfunded.
-
- Economic gains have been unequally distributed, favouring capital over labour.
- Absence of reliable social indicators in GDP underrepresents ground realities like nutrition levels, education access, and health infrastructure.
Drivers of India’s growth: Domestic structural reforms
- Unified indirect tax regime (GST): Streamlined India’s fragmented tax structure, boosting compliance and revenue stability.
Example: Gross GST collections averaged ₹1.84 lakh crore per month in early FY 2024–25, up 9.1 percent year-on-year.
- Production-Linked Incentive (PLI) schemes: Catalyzed manufacturing in electronics, pharmaceuticals and automobiles by incentivizing domestic value addition.
Example: The manufacturing value of mobile phones has surged from ₹18,900 crore in FY14 to a staggering ₹4,22,000 crore in FY24.
- Record infrastructure capital expenditure: Accelerated highways, rail and energy projects, cutting logistics costs and easing bottlenecks.
Example: Infrastructure capex rose from 1 percent of GDP in FY 2014 to 3.5 percent in FY 2024.
- Digital public-goods and financial inclusion: UPI and related reforms broadened access to payments and credit, fueling consumption and SME activity.
Example: Unified Payments Interface (UPI) achieved a historic milestone by processing 16.58 billion financial transactions in a single month.
- Labor and ease-of-doing-business reforms: Simplified registration, compliance and dispute resolution, attracting investment in manufacturing and services.
Example: India’s Doing Business ranking improved from 142nd in 2014 to 63rd in 2019.
Drivers of India’s growth: Global economic realignments
- Supply-chain diversification (“China + 1”): Multinationals shifted production to India to reduce overreliance on China.
Example: Foxconn announced a $1.5 billion display-module plant in Tamil Nadu in 2025 to supply a larger share of global iPhone output.
- Surging FDI inflows: Liberalized caps and investor-friendly policies attracted record foreign capital.
Example: India logged $81 billion in FDI in FY 2024–25, more than double its 2013–14 level.
- Demographic dividend: A young workforce expanded the labor pool, underpinning growth in services, manufacturing and consumption.
Example: The working-age population share rose to 65 percent, the highest among major economies.
- Boom in IT-BPM exports: Geopolitical tensions drove global firms to offshore technology and back-office work to India.
Example: IT-BPM revenues reached $254 billion in FY 2024, with exports touching $200 billion.
- Green energy and climate finance: International capital flowed into India’s renewable-energy build-out under global decarbonization drives.
Example: The share of renewable energy (RE) in India’s total foreign direct investment (FDI) inflows surged from approximately 1 per cent in FY21 to nearly 8 per cent in FY 2024-25.
|
Way Forward
- Adopt Complementary Indicators: Integrate metrics like Human Development Index (HDI), Gini coefficient, and employment data alongside GDP for a holistic view of economic well-being.
- Improve Data Transparency and Quality: Strengthen statistical systems, ensure methodological consistency, and reduce political interference to maintain the credibility of national accounts.
- Improve Employment Quality and Formalisation: Strengthen minimum wage enforcement and labour market reforms.
- Focus on skill development and digital inclusion.
- Invest in Human Capital: Increase public spending on healthcare, education, and nutrition to create long-term developmental impact.
- Reform Economic Narrative: Avoid overreliance on headline GDP rankings.
- Recognise structural challenges in income inequality, job creation, and institutional capacity.
Conclusion
While India’s rise to the fourth-largest economy by nominal GDP is notable, it offers only a partial picture. For meaningful comparisons and policy direction, composite socio-economic indicators must supplement GDP rankings. Real development should prioritize inclusive growth, employment quality, and social well-being over absolute economic size.
About GDP
- GDP is a monetary measure of the total market value of all final goods and services produced within a country over a specific period.
- Purpose: Used to assess the economic health of a country or region.
Types of GDP
- Nominal GDP Measures economic output using current prices without adjusting for inflation.
- Calculation: All goods and services are valued at their selling prices in the year they are produced.
- Real GDP: An inflation-adjusted measure of economic output, reflecting the actual quantity of goods and services produced.
 Real GDP is calculated using “constant” prices, removing the effect of inflation or price changes. Real GDP is calculated using “constant” prices, removing the effect of inflation or price changes.- Estimating Real GDP
- Base year is used to estimate real GDP and is updated every 5-10 years.
- The National Statistical Office (NSO) is responsible for revising the GDP base year to reflect changes in prices and economic output.
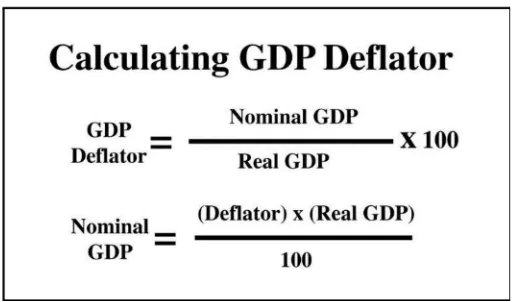
- Calculation: Uses a GDP price deflator to account for price changes between the current year and the base year.
- Nominal GDP is divided by the deflator to obtain real GDP.
|
Additional Reading: GDP, Base Year Revision


 2 Jun 2025


.png)


 Current Affairs


 GS Foundation
 Optional Course
 Combo Courses
 Degree Program