Some critics of Poverty estimation methodology propose using a “Thali Index” instead of calorie-based poverty measurement to better reflect nutritional and cultural standards of food consumption in India
What is Poverty?
- Poverty is commonly defined as the condition where an individual or household is unable to meet its basic needs, such as food, shelter, education, and healthcare.
- According to the World Bank, poverty is “the condition of not having sufficient income or resources to meet basic living standards“.
- Absolute vs. Relative Poverty:
- Absolute Poverty: Refers to those who do not have enough income or resources to meet basic survival needs. This is often quantified in terms of a poverty line.
- Relative Poverty: Measures poverty in relation to the standard of living of the majority in society.
- The United Nations defines relative poverty as “the condition in which a household’s income is below a certain percentage of the median income of the society in which they live”.
The Poverty Line in India
- The poverty line is a threshold income or consumption level used to distinguish the poor from the non-poor. Those who fall below this line are considered poor.
- In India, this has traditionally been calculated based on minimum calorie consumption, adjusted for regional differences in cost of living and essential non-food items.
- 24.82 crore Indians escaped Multidimensional Poverty from 2013-14 to 2022-23.
Poverty Estimation Methodologies
- Dandekar and Rath (1971) Approach: Introduced the first calorie-based poverty line.
- The first systematic estimation of poverty in India, based on the 1960-61 NSS data. The calorie norm was set at 2250 kcal/day.
- Alagh Task Force (1979): Refined the calorie-based poverty line.
- Introduced an adjusted calorie norm of 2400 kcal/day for rural areas and 2100 kcal/day for urban areas.
- This approach is rooted in the nutritional adequacy of food consumed.
- Lakdawala Committee (1993): Introduced a state-specific approach using CPI-AL (Consumer Price Index of Agricultural Labour) and CPI-IW (Consumer Price Index of Industrial Workers) for rural and urban areas, respectively.
- The Poverty Line is based on the consumer expenditure data from the 1973-74 NSSO survey, adjusted for inflation.
- Discontinuation of ‘scaling’ of poverty estimates based on National Accounts Statistics.
- Tendulkar Committee (2009): India’s last officially recognised poverty line.
- They used a poverty line based on a monthly per capita expenditure that reflected both food and non-food items.
- It considered calorie norms (2400 kcal/day for rural India and 2100 kcal/day for urban India) but also added essential expenditures like health, education, and housing.
- Unified consumption basket for both rural and urban areas.
- Rangarajan Committee (2014): He recommended a higher poverty line by incorporating both food and essential non-food expenditures.
- More comprehensive poverty estimation but still retained calorie-based norms.
- Set the poverty line at ₹47 per day for urban areas and ₹30 per day for rural areas
- Its recommendation was never officially accepted.
- World Bank: Uses a methodology based on international poverty lines, primarily using purchasing power parity (PPP) exchange rates to compare living standards across countries.
- The World Bank raised its threshold poverty line to $3 a day (daily consumption of less than $3) from the earlier $2.15 a day, the extreme poverty rate for India.
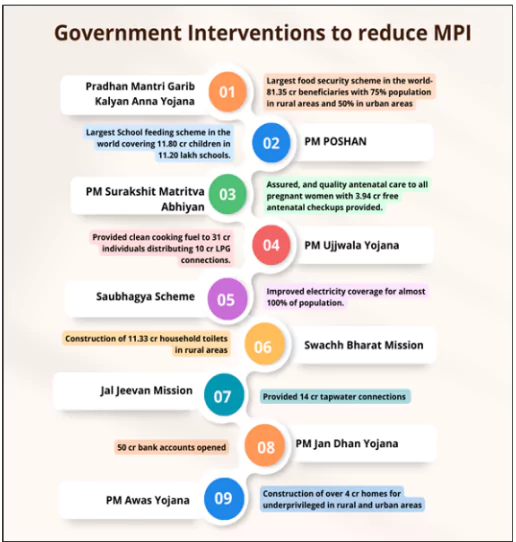
- Multidimensional Poverty Index (MPI): The MPI measures poverty based on multiple deprivations, such as education, health, and living standards, in addition to income or consumption.
- Method: Includes indicators like child mortality, years of schooling, access to clean water, and sanitation.
- Implemented by: NITI Aayog in India.
- Findings: 24.82 crore Indians escaped Multidimensional Poverty from 2013-14 to 2022-23.
- Steep decline in Poverty Headcount Ratio from 29.17% in 2013-14 to 11.28% in 2022-23.
Current Poverty Estimates in India
- Tendulkar Committee: The Tendulkar Committee (2009) set the official poverty line at Rs. 27.20 per capita per day in rural areas and Rs. 33.40 per capita per day in urban areas.
- According to the official estimates, poverty in India has declined from 45% in 1993-94 to 22% in 2011-12.
- SBI (State Bank of India) estimates rural poverty at 4.86% and urban poverty at 4.09% for FY24.
- World Bank: India’s extreme poverty rate declined from 27.1% in 2011-12 to 5.3% in 2022-23, lifting 171 million people out of extreme poverty.
- The poverty rate at the $3/day threshold was 5.44% in 2024, with significant reductions in both rural and urban areas.
|
Data Collection Methods and Approaches in India
- Modified Mixed Recall Period (MMRP): The MMRP method is used to improve data accuracy by using different recall periods for different types of goods.
- It addresses recall bias by using 30-day recall for food and 365-day recall for non-food items like durable goods or healthcare expenses.
- NSSO (National Sample Survey Office): MMRP was introduced in the 2017-18 NSS consumption survey as part of efforts to improve the accuracy of consumption expenditure data.
- Uniform Recall Period (URP): URP uses a uniform recall period, typically 30 days, for all items, whether frequently or infrequently purchased.
- NSSO: Historically used in many rounds of the NSS surveys before the introduction of MMRP.
- Limitations: While simpler, this method can lead to inaccuracies in recalling expenditures for less frequent items like durable goods, health, or education.
- Consumer Pyramids Household Survey (CPHS): The CPHS collects data on income, consumption, and socio-economic conditions of households, providing real-time insights into the economy.
- The CPHS is conducted annually by CMIE (Centre for Monitoring Indian Economy).
- National Sample Survey (NSS): The NSS conducts large-scale surveys to collect data on consumption, employment, and socio-economic conditions. The Household Consumption Expenditure Survey (HCES) is a critical part of the NSS used to estimate poverty.
- The NSS is conducted periodically by the National Sample Survey Office under the Ministry of Statistics and Programme Implementation (MoSPI).
- Limitations: Data quality concerns, particularly with the 2017-18 HCES, have led to gaps in poverty estimates.
- Periodic Labour Force Survey (PLFS): PLFS tracks employment, unemployment, income, and consumption data to provide insights into labor market conditions.
- MoSPI (Ministry of Statistics and Programme Implementation): PLFS was launched by MoSPI in 2017-18 to provide more frequent employment data than the decennial Census.
- National Family Health Survey (NFHS): The NFHS collects data on health, family welfare, and nutrition, including maternal and child health, fertility rates, and nutrition levels.
- NFHS is conducted by the Ministry of Health with technical support from IIPS (International Institute for Population Sciences).
Criticism and Limitations of Current Poverty Estimation in India
- Overemphasis on Calorie Intake: The calorie-based approach focuses solely on energy intake, typically set at 2400 kcal/day for rural areas.
- This method overlooks the nutritional value, variety, and cultural relevance of food, failing to address food security concerns beyond calories.
- Outdated Consumption Baskets: The poverty line continues to rely on consumption baskets from 1973-74, which do not reflect modern consumption patterns.
- These baskets fail to account for significant changes in household spending on non-food items like healthcare, education, and transportation.
- Narrow Focus on Monetary Measures: Official poverty estimates focus primarily on income or consumption expenditure.
- This approach excludes non-monetary deprivations, such as access to health, education, sanitation, and housing, which are essential for assessing overall well-being.
- Inconsistent Data: The NSSO surveys face significant data quality issues. For example, the 2017-18 Household Consumption Expenditure Survey (HCES) was not released due to data concerns.
- Furthermore, discrepancies between the NSSO and National Accounts Statistics (NAS) have made comparisons difficult, leading to inconsistencies in poverty estimates.
- Rural Poverty Underestimated: In 2023-24, up to 40% of rural India could not afford two basic meals (thalis) a day.
- This shows that food deprivation is far higher than suggested by official poverty estimates, which fail to capture the extent of rural food insecurity.
- Exclusion of Non-Food Essentials: The current methodology neglects spending on critical non-food essentials like healthcare, education, and housing, which have become an increasing portion of household expenditure.
- These omissions prevent a comprehensive assessment of poverty, as they are key to the overall well-being of the poor.
- Failure to Reflect Real Food Insecurity: Traditional poverty estimates based on total consumption overlook food insecurity.
- The Thali Index reveals that 40% of rural India and 10% of urban India cannot afford two basic meals a day. This indicates much higher levels of food deprivation than current poverty measures suggest.
Food Insecurity and the Thali Index
- Food insecurity refers to the lack of consistent access to sufficient, nutritious food for an active and healthy life.
- It is not just about the quantity of food but also the quality, availability, and affordability of food.
- The Thali Index is a proposed method of measuring poverty and food insecurity in India.
- Instead of focusing solely on calorie intake, it calculates the affordability of a basic meal, or thali, which typically includes rice/roti, lentils, vegetables, and sometimes dairy or meat, depending on dietary and economic factors.
- The Thali Index is based on the cost of a vegetarian thali—calculated at Rs 30, using data from Crisil on the price of home-cooked thalis across different regions of India.
How Thali Index Reflects Ground Reality of Food Affordability and Poverty in India?
- Measures Actual Food Deprivation: Unlike calorie-based poverty estimates, which focus only on energy intake, the Thali Index takes into account the full nutritional value of food.
- It recognizes that food is not only about calories but also about its quality and diversity, which are critical for health.
- Culturally Relevant: The thali is a culturally significant and nutritionally balanced meal across India.
- It serves as a practical measure that reflects the everyday eating habits of Indian households.
- By considering the cost of such a meal, the Thali Index is more in tune with the real needs and consumption patterns of the population.
- Improved Measurement of Food Insecurity: 40% of rural India and 10% of urban India cannot afford two basic thalis per day, according to the Thali Index calculation for 2023-24.
- This finding highlights a significant food deprivation problem that is not captured by traditional poverty estimates, which focus more on income rather than actual food security.
- Realistic Assessment of Affordability: The Thali Index assesses food affordability based on actual food expenditure, not total consumption expenditure.
- It reflects the reality that food often becomes a residual expenditure after essential non-food items like housing, healthcare, and education have been accounted for.
- Therefore, it offers a more accurate representation of a household’s ability to meet its food needs.
- Highlighting Regional and Socioeconomic Disparities: By considering the cost of thalis across regions and states, the Thali Index accounts for the differences in food prices and living costs.
- This is especially important in a diverse country like India, where the cost of food can vary significantly between rural and urban areas, as well as among states.
- Helps Rationalize Subsidies: Many households just above the poverty line can afford more than two thalis a day without subsidies, while those at the lowest income levels still struggle.
- This highlights the need for targeted food subsidies, rather than a blanket approach, ensuring that the most vulnerable populations are supported.
Key Differences: Traditional Poverty Measures vs Food Security Measures
| Aspect |
Traditional Poverty Measures |
Food Security Measures |
| Focus |
Income/consumption expenditure, often on calories |
Affordability and quality of food, including nutrition |
| Measurement Criteria |
Based on financial resources (monetary threshold) |
Based on access to adequate, nutritious food |
| Method |
Calorie norms (e.g., 2400 kcal/day) and consumption baskets |
Cost of meals, food access, and seasonal availability |
| Limitations |
Ignores nutrition and quality of life |
May not capture broader dimensions of poverty like health and education |
| Data Used |
Income and consumption surveys |
Cost of food, availability, and nutritional intake |
| Implication |
Focuses on basic survival needs; lacks broader context |
Provides insight into food insecurity, not just poverty |
Impacts of Food Inflation on Poor and Poverty Measurement
Impact on the Poor
- Higher Food Costs: Food inflation increases the price of staples like grains, vegetables, and pulses, making it harder for the poor to afford basic nutrition.
- In 2023-24, 40% of rural India and 10% of urban India could not afford two basic meals (thalis) a day.
- Nutritional Deprivation: As food prices rise, households reduce food quality and quantity, leading to malnutrition.
- Rising food costs force families to cut back on healthier foods, leading to poorer nutritional outcomes.
- Strain on Budgets: The poor spend a large portion of their income on food.
- Food and beverages account for 45.9% of the Consumer Price Index (CPI), meaning any increase in food prices directly impacts household budgets, leaving less for other essential needs like healthcare and education.
Implications for Poverty Measurement
- Underestimation of Poverty: Traditional poverty lines, based on total consumption, fail to account for the impact of rising food costs on food insecurity.
- For example, despite poverty estimates suggesting significant reductions, food deprivation remains much higher than reflected.
- Need for Food-Centric Measures: The Thali Index, based on the affordability of basic meals, offers a better reflection of food deprivation caused by inflation.
- This method highlights that food insecurity in India is much higher than traditional poverty lines suggest.
- Updating Poverty Lines: Poverty lines must be updated regularly to reflect food price increases.
- The official poverty line, last updated in 2011-12, has failed to capture changes in food costs, which have been rising steadily.
Way Forward
- Adopt the Thali Index for Comprehensive Poverty Measurement: The Thali Index, based on the affordability of a nutritious meal, should be integrated into poverty measurement alongside traditional calorie-based methods.
- It offers a more accurate representation of food security, addressing nutritional deprivation and affordability.
- Regularly Update Poverty Lines: Official poverty lines must be updated periodically to reflect rising food prices, regional variations, and changing consumption patterns.
- The current poverty line, last updated in 2011-12, fails to capture the real cost of living.
- Incorporate Multidimensional Poverty Measures: Multidimensional Poverty Index (MPI) should be integrated into mainstream poverty estimation.
- This will include education, health, and living standards, offering a more comprehensive understanding of deprivation.
- Improve Data Collection and Quality: The government must enhance the accuracy and consistency of data collection methods, especially through NSSO, PLFS, and CPHS.
- Addressing inconsistencies in survey data, such as those in 2017-18 HCES, will improve the reliability of poverty estimates.
- Targeted Welfare and Subsidy Distribution: Subsidies should be rationalized and targeted to focus on the most vulnerable populations, especially in rural areas.
- The Thali Index can help in identifying those in need, ensuring that food assistance reaches those struggling with food insecurity.
- Focus on Non-Food Essentials: Poverty measures should not only account for food but also include essential non-food expenditures such as healthcare, education, and housing.
- These are increasingly crucial for understanding overall deprivation.
- Strengthen Social Safety Nets: Enhance the effectiveness of public welfare programs like PDS, MGNREGA, and health subsidies.
- Integrating accurate poverty measures into these programs can ensure they are more inclusive, reducing inequality and improving living standards.
Conclusion
To accurately measure and alleviate poverty in India, it is essential to move beyond traditional calorie-based poverty lines and embrace more comprehensive measures like the Thali Index and the Multidimensional Poverty Index. These methods will help address current shortcomings in capturing real food insecurity and broader deprivations, leading to more effective policy solutions.
Additional Readings: Global Multidimensional Poverty Index


 3 Jul 2025


.png)


 Current Affairs


 GS Foundation
 Optional Course
 Combo Courses
 Degree Program