NCERT NOTES

Elevate your UPSC preparation with NCERT Notes – because every word matters on your journey to success.

Graphical Representation of Motion: Distance-Time & Velocity-Time Graphs

December 14, 2023 2224 0

The Power of Graphs in Understanding Object Motion

Graphs are a powerful tool for visually representing the motion of objects, enabling clearer understanding and analysis.
Distance–Time Graphs: Graphical representation of Motion

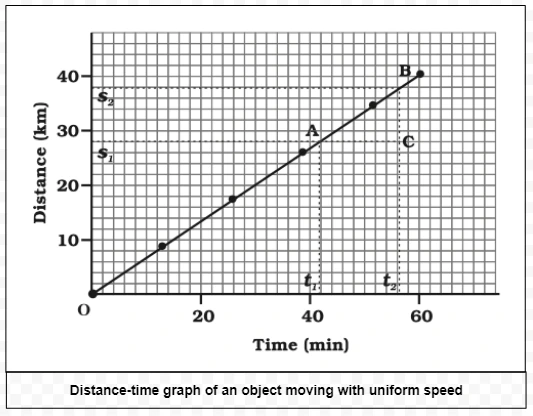
Distance-time graph of an object moving with uniform speed

  • These graphs depict the graphical representation of motion and how the position of an object changes over a period of time.
    • The x-axis represents time.
    • The y-axis represents distance or displacement.
  • Uniform Speed: When an object covers equal distances in consistent time intervals, it’s said to move with a uniform speed.
    • In such cases, the graph is a straight line. 
    • The gradient or slope of this line indicates the speed.
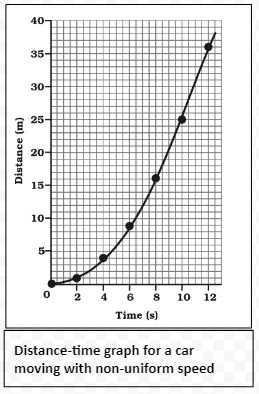
  • Non-uniform Speed:
    • The graph displays non-linear variations when the distance covered varies over time.
    • The specific shape of the curve offers insights into the nature of the non-uniform motion.

Distance-time graph for a car moving with non-uniform speed

Example of Graphical Representation of Motion

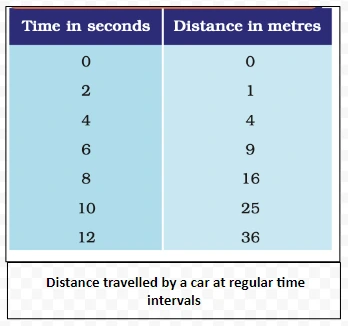
 Distance travelled by a car at regular time intervals

  • To determine the speed of an object using a distance-time graph, one can take the following steps:
  • Identify Two Points: Let’s consider two points, A and B, on the distance-time graph.
  • Draw Parallel Lines: From point A, draw a line parallel to the x-axis, and from point B, draw another line parallel to the y-axis. 
  • These lines intersect at a point, C, forming a triangle ABC.
  • Determine Time and Distance: On the graph:
    • The horizontal line segment AC represents the time interval (t2​−t1)​.
    • The vertical line segment BC indicates the change in distance (s2​−s1)​.
  • Calculate Speed: As the object moves from point A to point B, the change in its position is (s2​−s2) over the time interval (t2​−t1)​. 
  • Therefore, the object’s average speed v during this interval is given by:

v =  s2​−s1/t2​−t1

Furthermore, distance-time graphs can also represent accelerated motion. For example, Table 1.1 illustrates distances covered by a car every two seconds, demonstrating an accelerated motion.
Velocity-Time Graphs: Graphical representation of motion

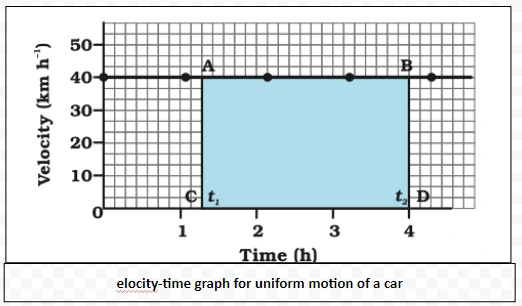
elocity-time graph for uniform motion of a car

  • These graphs through graphical representation of motion depict how an object’s velocity changes over time.
    • The x-axis represents time.
    • The y-axis represents velocity.
  • Uniform Velocity:
    • When the velocity of an object remains consistent over time, its graph is a horizontal line.
    • The area beneath the graph between two time points indicates the object’s displacement.

Understand the graphical representation of motion Through an Example:

Velocity of a car at regular instants of time

  • Above velocity-time graph is for a car moving at a consistent speed of 40 km/h. 
  • For objects moving at uniform velocity, the product of their velocity and time yields the displacement. 
  • Consequently, the area between the velocity-time graph and the time axis represents the total displacement.
  • To ascertain the distance covered by the car between the time intervals t1​ and t2​ using the above graph one should:
    • Draw Perpendicular Lines: From the points corresponding to times  t1​ and t2​ on the graph, draw perpendicular lines to the opposite axes.
    • Identify Graph Dimensions: The consistent velocity of 40 km/h is depicted by the vertical height (either AC or BD). Meanwhile, the horizontal distance AB represents the time interval t2​−t1
    • Calculate Distance: The distance the car traverses in the duration t2​−t is given by:

s = AC CD 

= [(40 km h-1) (t2​−t1)h] 

= 40(t2​−t1)km. This distance corresponds to the area of the rectangle ABCD.
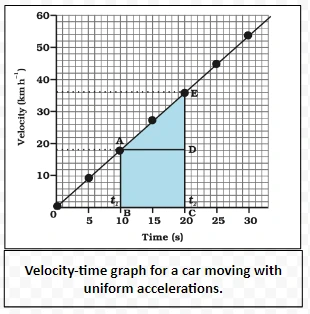
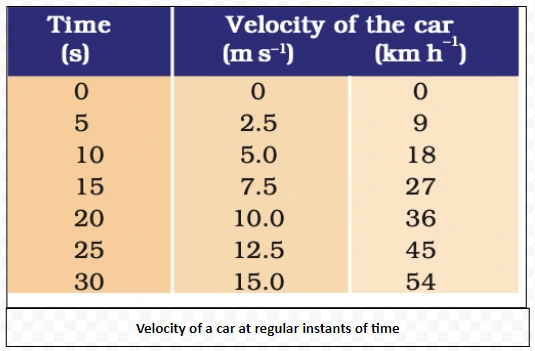
  • Additionally, to understand uniformly accelerated motion, consider a velocity-time graph. 
  • Envision a scenario where a car undergoes an engine test on a straight road. 
  • An observer in the car logs the vehicle’s speed every 5 seconds using its speedometer. 
  • Above table then showcases the car’s velocity in both km/h and m/s at various time snapshots.

  • Uniformly Accelerated Motion:
    • If the velocity of an object changes by consistent amounts in equal time intervals, the graph will be a straight line that isn’t necessarily horizontal.
    • The total area under the graph represents the distance or magnitude of displacement.
    • This area can be dissected into simpler geometric shapes, like rectangles and triangles, to ascertain the distance.
  • Non-uniformly Accelerated Motion:
    • The velocity-time graphs for non-uniformly accelerated motion can adopt different shapes and configurations.
    • The exact shape of the graph can be interpreted in different ways depending on the motion’s characteristics.

Velocity of a car at regular instants of time

Need help preparing for UPSC or State PSCs?

Connect with our experts to get free counselling & start preparing

THE MOST
LEARNING PLATFORM

Learn From India's Best Faculty

      
Quick Revise Now !
AVAILABLE FOR DOWNLOAD SOON
UDAAN PRELIMS WALLAH
Comprehensive coverage with a concise format
Integration of PYQ within the booklet
Designed as per recent trends of Prelims questions
हिंदी में भी उपलब्ध
Quick Revise Now !
UDAAN PRELIMS WALLAH
Comprehensive coverage with a concise format
Integration of PYQ within the booklet
Designed as per recent trends of Prelims questions
हिंदी में भी उपलब्ध

<div class="new-fform">


    </div>

    Subscribe our Newsletter
    Sign up now for our exclusive newsletter and be the first to know about our latest Initiatives, Quality Content, and much more.
    *Promise! We won't spam you.
    Yes! I want to Subscribe.