NCERT NOTES

Elevate your UPSC preparation with NCERT Notes – because every word matters on your journey to success.

Growth Rate Dynamics: Insights from India, China, and Pakistan

December 4, 2023 2737 0

Key Economic Development Indicators & Growth Rate

The Growth Rate Indicators can be broken down into various categories, showcasing different aspects of economic development.

Here are some key growth rate indicators:

GDP Growth Rates: China, India, Pakistan Comparison

  • China has the second-largest GDP (PPP) globally at $22.5 trillion, followed by India at $9.03 trillion, , with Divergent Growth Rates; Pakistan at $0.94 trillion (approximately 11% of India’s GDP).
  • India’s GDP is about 41% of China’s GDP.

Annual Growth of Gross Domestic Product (%), 1980–2017

Annual Growth of Gross Domestic Product (%), 1980–2017

Evolution of Growth Rates: A Historical Perspective on China, India, and Pakistan in the 1980s and 2015–17

  • In the 1980s, China maintained a near double-digit growth rate while Pakistan was ahead of India. 
  • However, by 2015–17, there was a decline in Pakistan and China’s growth rates, while India experienced a moderate increase.
  • Some scholars attribute Pakistan’s declining growth rate to reform processes and prolonged political instability.

Sector-wise GVA Contributions: Analyzing Growth Rates in Agriculture, Industries, and Services Across China, India, and Pakistan(Refer Table 16.5)

  • Agriculture:
    • In China, 26% of the workforce is engaged in agriculture, contributing 7% to GVA.
    • In India and Pakistan, agriculture contributes 16% and 24% to GVA, with a higher proportion of the workforce (43% in India and 41% in Pakistan) engaged in agriculture, impacting the sector’s growth rate dynamics. 
  • Industries:
    • China’s industries contribute 41% to GVA, employing 28% of the workforce.
    • In India, industries contribute 30% to GVA, employing 25% of the workforce.
    • Pakistan’s industry workforce accounts for 24%, contributing 19% to GVA.
  • The Service Sector: It is the largest contributor to GVA in all three countries.

Service Sector Growth and Employment Shift: A Glimpse at China, India, and Pakistan’s Growth Rate 

Sectoral Share of Employment and GVA (%) in 2018–2019

Sectoral Share of Employment and GVA (%) in 2018–2019

  • Economic Transition and Growth Rate Dynamics
    Agriculture to Industry to Services: Countries typically shift employment and output from agriculture to industry and then to services. 

    • This pattern is evident in China.
    • In the 1980s, Pakistan showed a faster shift to the service sector, employing 27% of its workforce, compared to India (17%) and China (12%).
  • Service Sector Employment: In 2019, the service sector employed 35% of Pakistan’s workforce, 32% in India, and 46% in China.
  • Agriculture Sector Growth Rate: Over the last five decades, the growth of the agriculture sector, which employs the largest proportion of the workforce, has declined in all three countries (Refer Table).
  • Manufacturing and Service Sectors Growth Rate: China’s growth is contributed by the manufacturing and service sectors, while India’s growth is mainly attributed to the service sector.
  • Pakistan has shown deceleration in all three sectors during this period.

Trends in Output Growth in Different Sectors, 1980–2015
Trends in Output Growth in Different Sectors, 1980–2015

Human Development Indicators: Growth Rate Differences in China, India, Pakistan

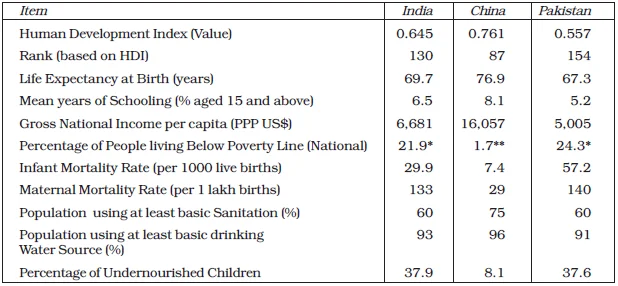
  • Table indicates that China is outperforming India and Pakistan across various human development indicators, including income indicators (GDP per capita), poverty rates, health indicators (mortality rates, access to sanitation), literacy, life expectancy, and malnourishment.
  • Progress in Poverty Reduction and Sanitation: Both China and Pakistan are ahead of India in reducing the proportion of people below the poverty line and achieving better sanitation outcomes.
  • Maternal Mortality Rates and Growth Rate Differences: 
    • China has a significantly lower maternal mortality rate compared to India and Pakistan. For every one lakh births, only 29 women die in China, 
    • While in India and Pakistan, the figures are about 133 and 140, respectively.
  • Access to Improved Drinking Water: Surprisingly, all three countries report providing improved drinking water sources for most of their populations.
  • Proportion of Poverty Rates: China has the smallest share of the poor among the three countries.

Some Selected Indicators of Human Development, 2017-2019

Some Selected Indicators of Human Development, 2017-2019

Beyond Growth Rates: Assessing Challenges and Limitations in Human Development Indicators

  • Beyond Human Development Indicators: Exploring Growth Rate Challenges and Limitations –  While human development indicators are crucial, they may not be sufficient for a comprehensive assessment.
  • Need for Liberty Indicators: 
    • The limitations include the absence of what are referred to as liberty indicators.
    • It encompasses aspects like democratic participation, constitutional protection of citizens’ rights, and independence of the judiciary and the rule of law.
  • Thus, The construction of a human development index may be considered incomplete without these liberty indicators, and their importance in the overall assessment is emphasized.

Development Strategies: Growth Rate Dynamics in India, Pakistan, and China

Pre-Reform Period Post-Reform Period
India
  • India’s Growth Rate Initiatives: Economic reforms in 1991 due to a balance of payments crisis, necessitating borrowing from the IMF and World Bank.
  • Post-1991, India shifted its focus towards sustainable export of manufactured goods, ushering in a liberalized economic model.
  • The country witnessed positive Growth Rate  outcomes with stable and improved macroeconomic indicators.
Pakistan
  • Pakistan embarked on economic reforms in 1988, encountering challenges in GDP growth and sectoral performance.
  • Pakistan’s foreign exchange earnings relied heavily on remittances and volatile agricultural exports, leading to increased dependence on foreign loans.
  • Despite challenges, Pakistan has seen economic recovery, with a notable 5.5% GDP growth in 2017-18.
  • The agricultural sector’s growth remained below satisfactory levels, while the industrial and service sectors experienced growth at 4.9% and 6.2%, respectively.
China
  • In 1978, China introduced Growth Rate reforms due to dissatisfaction with the slow growth under Maoist rule and the perceived failure of a decentralized, self-sufficient model.
  • Post-1978, China implemented reforms in education, health, and land, resulting in positive impacts on social and income indicators.
  • Basic health services were extended, and equitable food distribution was promoted through experimentation under decentralized governance.
  • Reforms in agriculture, such as land distribution, contributed to Growth Rate  prosperity and rural industrial growth, paving the way for rapid economic development.
Table: Development of India, Pakistan, and China

Conclusion

  • In this chapter, we have explored critical facets of India’s economic landscape, focusing on Growth Rate in rural development and food security, while also drawing comparative insights from the developmental paths of China and Pakistan. 
  • India’s path reflects its commitment to democracy and inclusive growth, with a focus on addressing rural disparities and food security. 
  • As India continues to navigate the complexities of rural development, food security, and its broader developmental path, the lessons learned from its own history and those of its neighbors can provide valuable insights into shaping a sustainable and equitable economic future. 
  • These experiences serve as critical reference points in the ongoing pursuit of prosperity, social equity, and food security in the South Asian region.

Glossary: A Reference Guide to Economic Terms, Including Growth Rate Dynamics

  • Commercialisation of Agriculture: The shift from subsistence farming to market-oriented crop production, was especially notable during British rule when cash crops were prioritised for industrial use.
  • Demographic Transition: A concept by Frank Notestein describing the changing patterns of birth and death rates in response to economic development, divided into pre-industrial, developing, modern industrialised, and post-industrial phases.
  • European Union (EU): A political and economic union of 25 (27 in  2023) independent European states formed to foster cooperation within the continent.
  • Formal Sector Establishments: Refers to public sector establishments and private sector businesses with 10 or more hired workers.
  • G-20: A forum of 19 countries, along with the European Union, aimed at promoting global economic stability and sustainable growth.
  • G-8: Comprising major industrialised nations, the G-8 holds an annual summit for economic and political discussions.
  • Gross Domestic Product (GDP): The total value of goods and services produced within a country’s borders in a year, irrespective of ownership.
  • Gross Value Added (GVA): Represents a country’s GDP plus subsidies and minus indirect taxes, providing a measure of economic output.
  • Household: A group of individuals living together and sharing a common kitchen.
  • Infant Mortality Rate: The number of infant deaths before the age of one per 1,000 live births in a specific year.
  • Land/Revenue Settlement: A system during British rule to administer territories based on land surveys, determining revenues from peasants, revenue villages, or proprietary landholders.
  • Life Expectancy at Birth: The expected number of years a newborn would live if mortality rates remain constant.
  • Maternal Mortality Rate: The ratio of maternal deaths related to childbearing to live births or the sum of live births and foetal deaths in a given year.
  • Mortality Rate and Growth Rate:  An annual count of deaths per 1,000 people, distinct from morbidity rate.
  • MRTP Act: The Monopolies Restrictive Trade Practices Act, is designed to prevent monopolistic practices and regulate business conduct.
  • Multilateral Trade Agreements: Trade agreements involving a country with more than two nations for the exchange of goods and services.
  • Planning Commission: An organisation in India responsible for assessing resources, formulating plans for their balanced utilisation, and determining priorities.
  • Poverty Line: The per capita expenditure on minimum needs, including daily calorie intake, used to measure poverty levels.
  • Private Sector Establishments: Businesses owned and operated by individuals or groups.
  • Unemployment: A situation where individuals actively seek employment but are not currently working.
  • Urbanisation: The expansion of metropolitan areas or the increase in the proportion of urban population relative to the total population.
  • Worker-Population Ratio: The percentage obtained by dividing the total number of workers by the population.

Need help preparing for UPSC or State PSCs?

Connect with our experts to get free counselling & start preparing

Aiming for UPSC?

Download Our App

      
Quick Revise Now !
AVAILABLE FOR DOWNLOAD SOON
UDAAN PRELIMS WALLAH
Comprehensive coverage with a concise format
Integration of PYQ within the booklet
Designed as per recent trends of Prelims questions
हिंदी में भी उपलब्ध
Quick Revise Now !
UDAAN PRELIMS WALLAH
Comprehensive coverage with a concise format
Integration of PYQ within the booklet
Designed as per recent trends of Prelims questions
हिंदी में भी उपलब्ध

<div class="new-fform">


    </div>

    Subscribe our Newsletter
    Sign up now for our exclusive newsletter and be the first to know about our latest Initiatives, Quality Content, and much more.
    *Promise! We won't spam you.
    Yes! I want to Subscribe.