Context:
This article is based on the news “Per Capita Monthly Household Consumption Expenditure more than doubled during 2011-12 to 2022-23” which was published in the PIB. Recently, the National Sample Survey Office (NSSO), under the Ministry of Statistics and Programme Implementation released the Household Consumer Expenditure Survey (HCES) conducted from August 2022 to July 2023.
Key Highlights On Household Consumption Expenditure Survey 2022-23
- The survey results show Indian household consumption and patterns, breaking 11-year data since the last exercise was conducted in 2011-12.
- Field work for the second year of HCES 2022-24 has been initiated from August 2023.
- Aim: To generate estimates of household Monthly Per Capita Consumption Expenditure (MPCE) and its distribution separately for the rural and urban sectors of the country, for states and Union Territories, and different socio-economic groups.
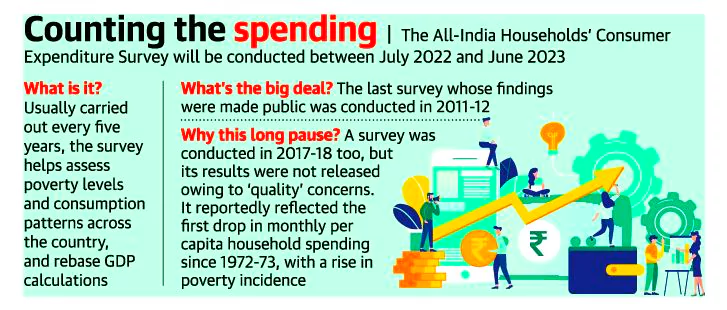
Why the Delay in the Survey?
- The survey is supposed to be held every five years. However, the latest iteration comes more than a decade after the previous one after the government controversially junked the 2017-18 survey, citing data quality issues.
- The government said there was a significant variation in the levels of consumption patterns and in the direction of change.
|
Monthly Per Capita Consumption Expenditure (MPCE):
- It is defined by NSSO as household consumer expenditure over a period of 30 days divided by the household size.
- Poverty line is defined on the basis of MPCE.
|
Crucial Insights From Household Consumption Expenditure Survey 2022-23
-
Growth in Consumption Expenditure:
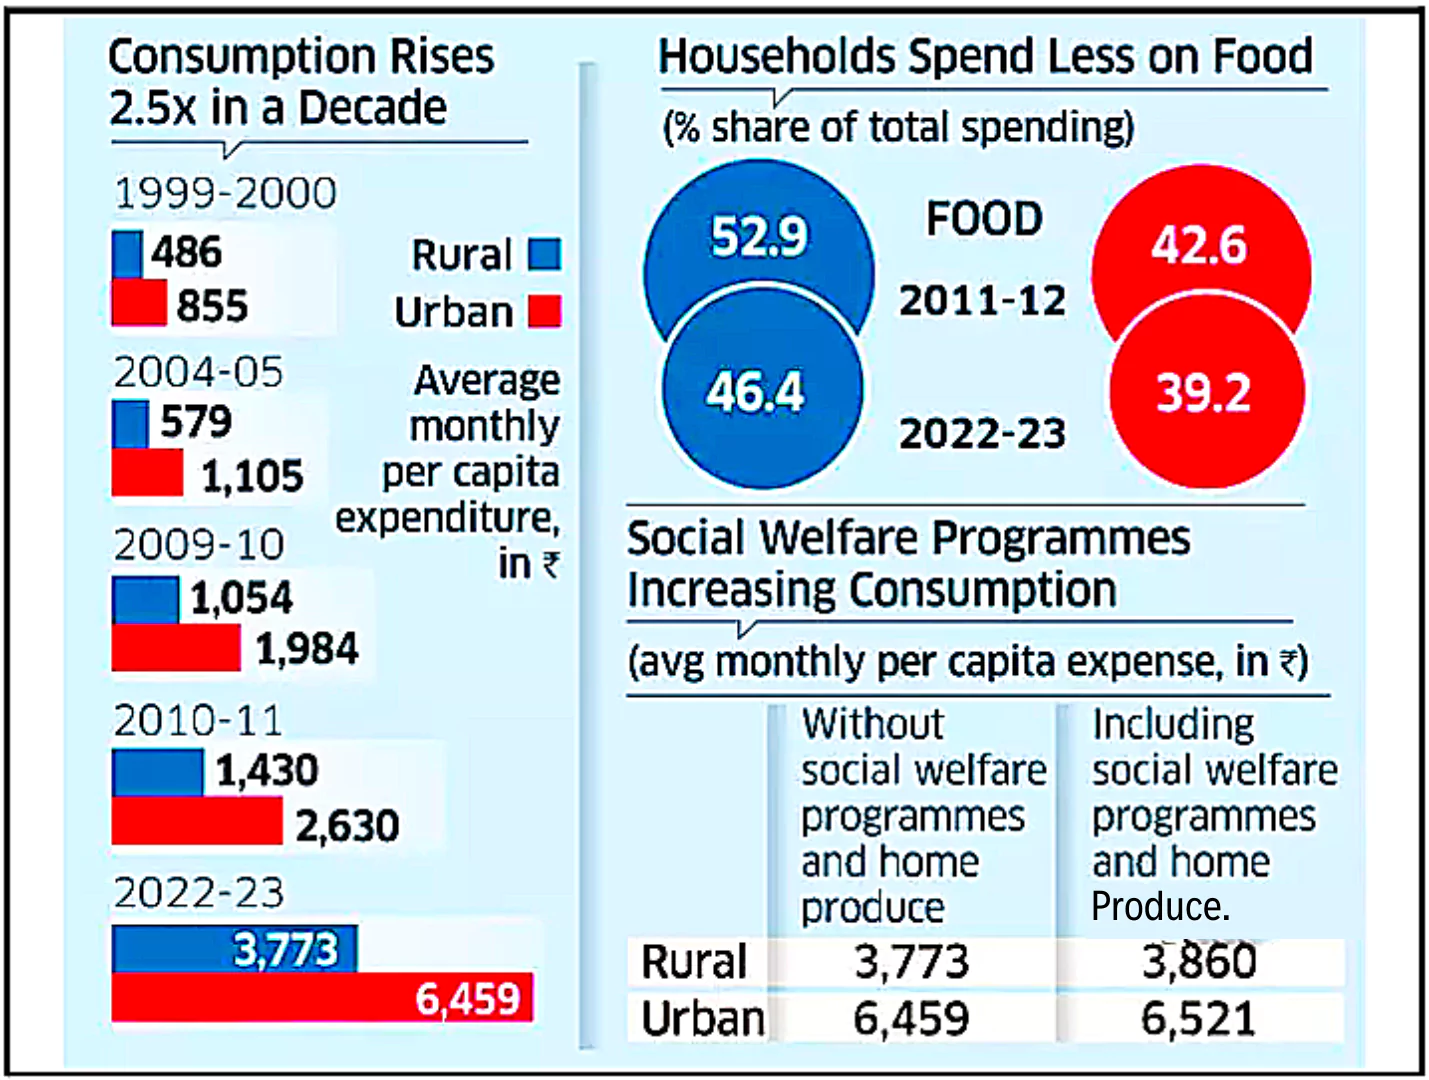
- The per capita monthly household expenditure more than doubled in 2022-23 compared to 2011-12.
- The Average Per Capita Monthly household Expenditure: It stood at Rs 3,773 in rural areas and Rs 6,459 in urban areas for all categories.
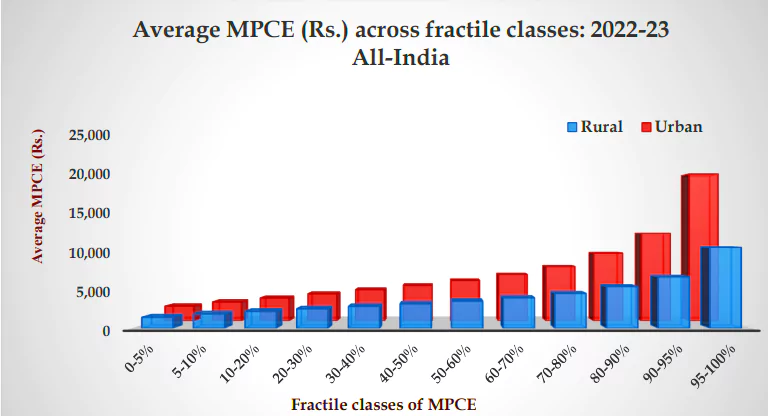
- The average per capita monthly expenditure of 0-5% fractile class is pegged at Rs 1,373 in rural areas and Rs 2,001 in urban areas.
-
Narrowing the Urban-Rural Gap:
- Consumption in rural areas is growing faster than in urban areas, narrowing the gap. The increase in consumption in rural and urban areas is about 2.5 times.
- According to the survey data, the gap was 84% in 2011-12 and reached 71% in 2022-23. The gap was at its peak of 91% in 2004-05.
-
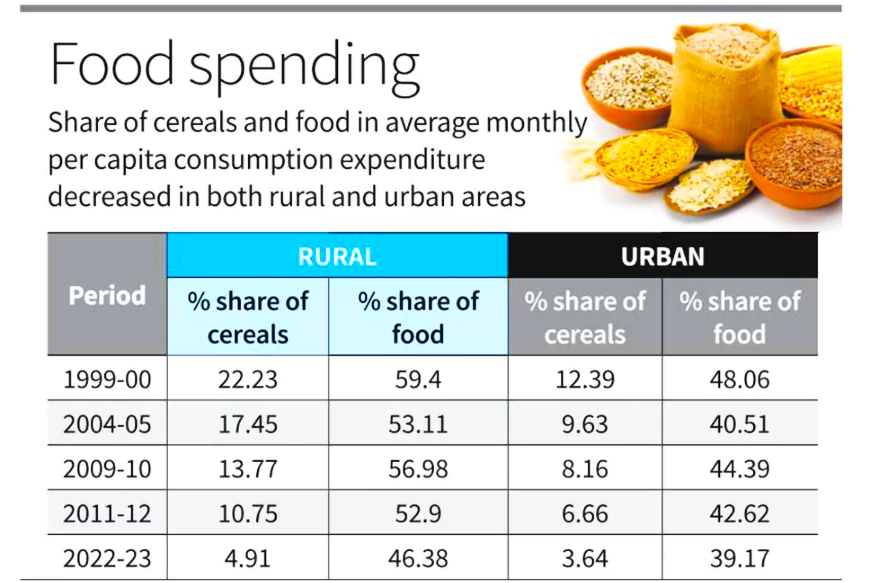
Significant Fall in the Consumption of Cereals and Food:
-
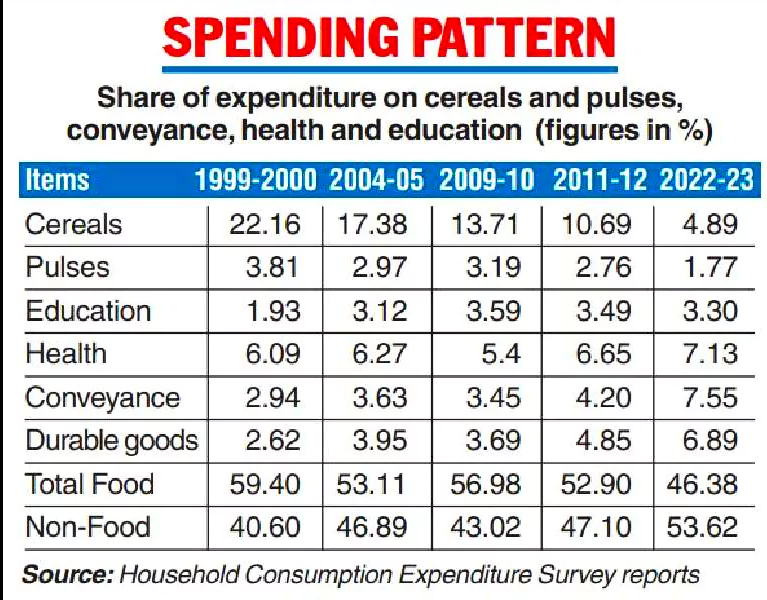
- In Rural Areas: Consumption of cereals as a share in the average MPCE has decreased from 22% in 1999-2000 and 10.7% in 2011-12 to less than 5% now.
- The total consumption of food as a share of the average MPCE has decreased from almost 60% in 1999-2000 and 53% in 2011-12 to 46% now.
- In Urban Areas: Consumption of cereals and food in urban areas has decreased from 12% in 1999-2000 and over 6% in 2011-12 to less than 4% now.
- While the total consumption of food in the average MPCE has gone down to 39% for the first time from almost 50% in 1999-2000 and 43% in 2011-12.
-
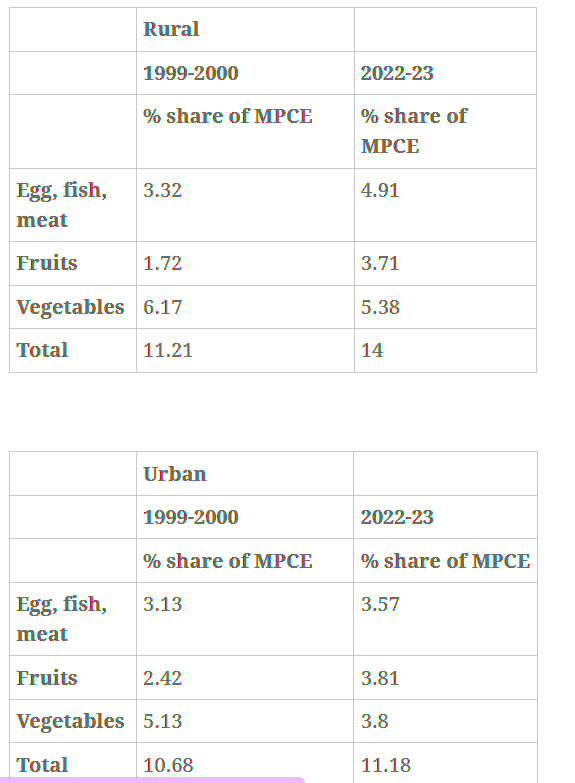
Increase in the Expenditure on High-value Items:
- Expenditure on high-value items such as eggs, fish, meat, fruits, and vegetables has increased.
- This expenditure in rural India has risen from 6.18% in 2011-12 to 9.01% in 2022-23, while in urban India, it has risen from 8.91% in 2011-12 to 10.54% in 2022-23.
-
Increase in the Expenditure on Non-food Items:
- The expenditure on non-food items has increased across all categories, with the highest expenditure on transport and communication.
- This expenditure in rural India has risen from 6.4% in 2011-12 to 14.65% in 2022-23, while in urban India has risen from 15.25% in 2011-12 to 23.69% in 2022-23.
-
Increase in the Expenditure on Education and Health:
- On Education: This expenditure in rural India has risen from 3.71% in 2011-12 to 6.08% in 2022-23, while in urban India has risen from 7.07% in 2011-12 to 8.07% in 2022-23. On Health: This expenditure in rural India has risen from 6.67% in 2011-12 to 8.25% in 2022-23, while in urban India, it has risen from 5.88% in 2011-12 to 7.13% in 2022-23.
-
Gap Narrowing in the Agriculture Sector:
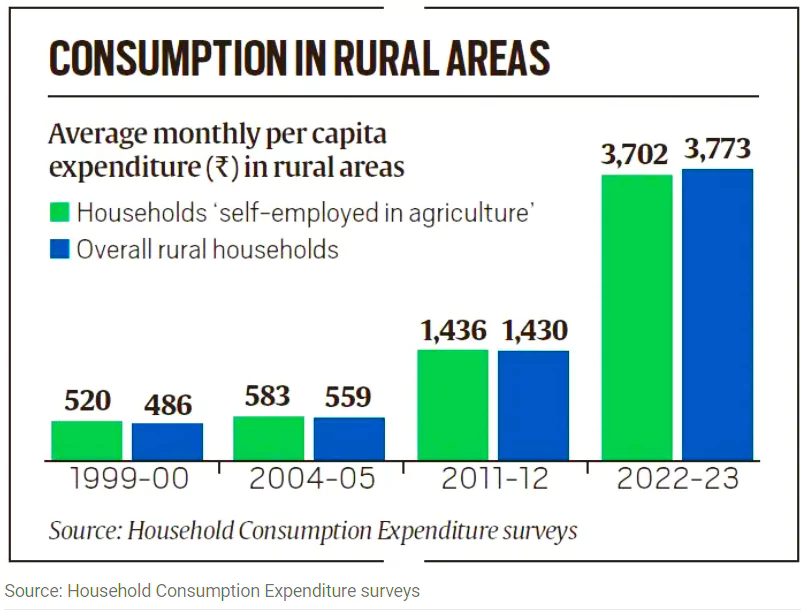
- The gap between the MPCE of agricultural families and the overall average of rural households has been narrowing over the years.
- The average MPCE of families “self-employed in agriculture” was Rs 3,702 in 2022-23, while the overall average of rural households was Rs 3,773.
-
On Average Spending:
-
- In 2011-12, the MPCE of agricultural households was Rs 1,436, a little more than the average rural spending of Rs 1,430.
- The average MPCE of households with “regular wage/salaried earning in agriculture” was Rs 3,597, while for “regular wage/salaried earning in non-agriculture” households was Rs 4,533.
-
For Casual Labors:
- Similarly, the average MPCE of households engaged in “casual labor in agriculture” was Rs 3,273, as compared to Rs 3,315 for “casual labor in non-agriculture”. State on Top and Bottom: The MPCE is the highest in Sikkim for both rural (₹7,731) and urban areas (₹12,105). It is the lowest in Chhattisgarh, where it was ₹2,466 for rural households and ₹4,483 for urban household members. The rural-urban difference in average MPCE: Highest in Meghalaya (83%) followed by Chhattisgarh (82%).
- Among UTs: MPCE is highest in Chandigarh (rural Rs 7,467 and urban Rs 12,575), and is the lowest in Ladakh (Rs 4,035) and Lakshadweep (Rs 5,475) for rural & urban areas.
-
On Imputed Average MPCE Data:
-
- The NSSO has provided an imputed value of items received free by households through various social welfare programmes.
- These include: i) food items such as rice, wheat, atta, pulses, salt, sugar, edible oil, etc and ii) non-food items such as laptop/ PC, tablet, mobile handset, bicycle, motorcycle/scooter, clothing (school uniform), footwear (school shoes, etc).
- The MPCE of rural and urban households, including the imputed value of free food and non-food items, is higher compared with the MPCE, which does not include the free items.
- A fractile class of MPCE is the segment of the population lying within two fractiles.
- In rural households, the bottom 0-5% of the population got the least to spend in terms of imputed value of free items. This group got just Rs 68.
- The population garnered the highest benefit in the 70-80% fractile and even the top 5% of the population got Rs 80.
About Household Consumer Expenditure Survey (CES):
- It is a Survey intended to collect information on the consumer spending patterns of households across the country, both urban and rural.
- Frequency of Survey: Quinquennial (every five years)
- Conducted by: National Sample Survey Office (NSSO)
- Utility of the Survey:
- The data is used for studies on levels of living in India and for the measurement of absolute poverty, including studies on disparities across States and regions, sectors, socio-economic classes etc.
- It helps to arrive at the estimates of household Monthly Per Capita Consumer Expenditure (MPCE) as well as the distribution of households and persons over the MPCE classes.
- It will be used for rebasing the Gross Domestic Product and other macroeconomic indicators such as retail inflation based on the Consumer Price Index.
New Changes in the Methodology of Survey:
- The Questionnaire of HCES 2022-23: It contains 405 items as against 347 items in 2011-12.
- Three Questionnaires: In HCES: 2022-23, three separate questionnaires covering (i) food items, (iii) consumables and services items, and (iii) durable goods have been used.
- However earlier, a single questionnaire was used in all NSS surveys on household consumption expenditure.
- Additional Questionnaire: Another questionnaire has been canvassed to collect information on household characteristics and demographic particulars of the members of the households.
- A Separate Collection: The HCES 2022-23 also includes a separate provision for the collection of information on the quantity of consumption for a number of items, received and consumed by the households free of cost through various social welfare programmes.
- However, the value of education as well as health services received free of cost by the households has not been imputed.
About National Sample Survey Office (NSSO):
- The NSSO headed by a Director General is responsible for conducting large-scale sample surveys in diverse fields on an All India basis.
- Primarily data are collected through nationwide household surveys on various socio-economic subjects, Annual Survey of Industries (ASI), etc.
- It also maintains a frame of urban area units for use in sample surveys in urban areas.
|
Positive Outcomes Household Consumption Expenditure Survey 2022-23
-
Cautiousness For Health & Well-being:
- An increase in the expenditure on high-value items shows that Indian households are consuming more nutritious and diverse diets, which may have positive implications for their health and well-being.
- In food items, people are spending more on milk, fruits and vegetables.
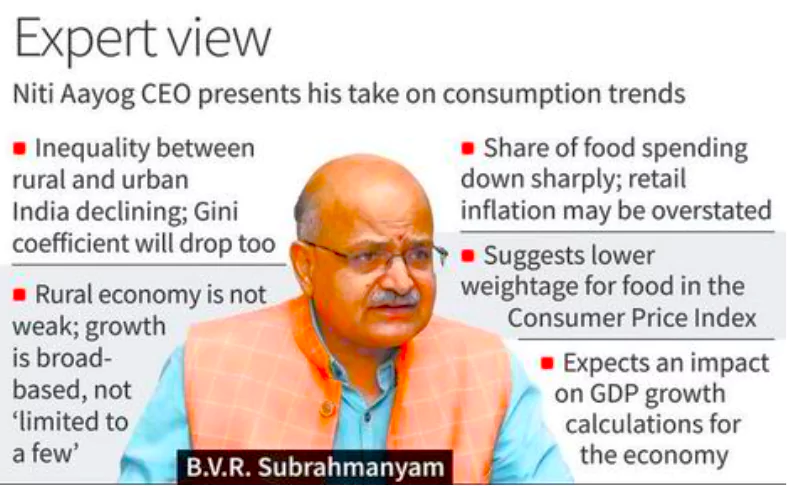
On Consumer Price Inflation (CPI) Revision:
- The government will also rejig and update the CPI baskets using this data.
- The new CPI series is likely to have a lower weight for food and beverage, and higher for core goods and services.
- The CPI revision will take some time and two back-to-back surveys are needed due to a change in the methodology and questionnaire.
- The new updated CPI series will probably take until Jul-Aug 2025 to be released.
|
-
Creation of Opportunities:
-
- The increase in the expenditure on transport and communication reflects the growing demand for mobility and connectivity, which may be driven by factors such as urbanization, migration, education, and employment opportunities.
-
High Standard of Living:
- An increase in the expenditure on non-food items shows that people are becoming prosperous with extra income.
- The most significant is that people are spending more on processed food.
- Processed Food: Food that has been altered in some way during preparation.
- An increase in the expenditure on non-food items indicates that Indian households have more disposable income and are spending more on discretionary items, such as clothing, footwear, transport, education, health, and entertainment.
-
Focus on Life Quality:
- An increase in the expenditure on education and health expenditure indicates that Indian households are investing more in human capital and quality of life.
- It is for the first time that expenditure on food has fallen. This is remarkable.
Significance of Conducting the Household Consumption Expenditure Survey 2022-23
- Helps in Assessment For Policy-Makers: The data is essential for updating the Consumer Price Inflation (CPI) baskets, gives policymakers and experts an assessment on the income and expenditure levels of households and gauges the efficacy of policy measures.
- Deriving Indicators: They are used for drawing up the weighting diagram for compiling price indices used to measure retail inflation and for deriving other macroeconomic indicators.
- Extracts the Needs and Desires of the Consumers: The data offers crucial insights into changing spending patterns and distribution and serves as a valuable resource for businesses, guiding the development of products and services tailored to consumers’ needs and preferences.
- Provides an Essence of Requirement: The data underscores the challenges and opportunities in improving living standards and welfare, particularly in food security, nutrition, healthcare, education, and social support.
- An Important Measure for RBI: The Reserve Bank of India (RBI) decides to increase or decrease the policy rate based on retail inflation, which impacts growth.
-
- A lower interest rate will help economic growth by facilitating loans at lower rates. But if the wrong data guides the RBI, it will most likely delay any action on interest rates.
- A Policy rate is a repo rate, the interest rate at which the central bank lends money to commercial banks.
Arising Concerns
- Decline in Value of Self-Employment in Agriculture: For the first time, self-employment in agriculture is lower than the rural household average of Rs 3,773. This implies that the latter has not kept pace with other groups.
 Fall in the Average MPCE of Agricultural Households: Compared to overall rural households, the average MPCE of agricultural households is decreased.
 -
- The average MPCE with imputation for agricultural households (Rs 3,783) was still lower than the overall average for rural households (Rs 3,860).
- The MPCE of casual laborers and regular wage earners engaged in agriculture was also lower than the rural average.
- The MPCE is a key indicator used for measuring poverty. This fall in the average MPCE of agricultural households as compared to overall rural households is significant in view of farm protests in recent years.
- Increase in Inequality at Higher Income Levels: The top 5% of India’s rural and urban population has an average MPCE of Rs 10,581 and Rs 20,846, respectively.
- The bottom 5% of India’s rural population has an average MPCE of Rs 1,441, while it is Rs 2,087 in urban areas.
- The difference between rural and urban MPCE has a bigger gap at the top, reflecting an increase in inequality at higher income levels. A difference of over 85% for the highest 10% of households implies rising income inequality at the top of the pyramid.
- Different Calculation for Welfare Programmes: The cited MPCE numbers do not take into account the imputed values of items received free of cost by individuals through various social welfare programmes such as the PM Garib Kalyan Ann Yojana (PMGKAY) or State-run schemes.
- They were calculated separately, while including a few non-food items received through such schemes, including computers, mobile phones, bicycles, and clothing.
Conclusion
The release of this survey marks an important step towards filling the data vacuum in the country. The next government should take this forward, initiate the much-delayed census exercise and take steps to strengthen the country’s statistical system.
Also Read: Viksit Bharat @2047
News Source: PIB
To read more on NSSO, click here
 26 Feb 2024