India China GDP Comparison: Overview, and Current Status

India China GDP Comparison: Overview, and Current Status

Context

As India aims for its vision for a developed India” by 2047, this article presents a comparison of economic growth story of India and China.

Relevance for Prelims: Vision India@2047, Economic Indicators, and Growth Rate Dynamics: Insights From India, China

Relevance for Mains: Relative economic growth of India and China. 

Overview of Indian GDP Growth Rate

  • Real GDP of  India: India’s real GDP grew at a much slower rate by 5.8% in the 1990s and 6.3% in the 2000s
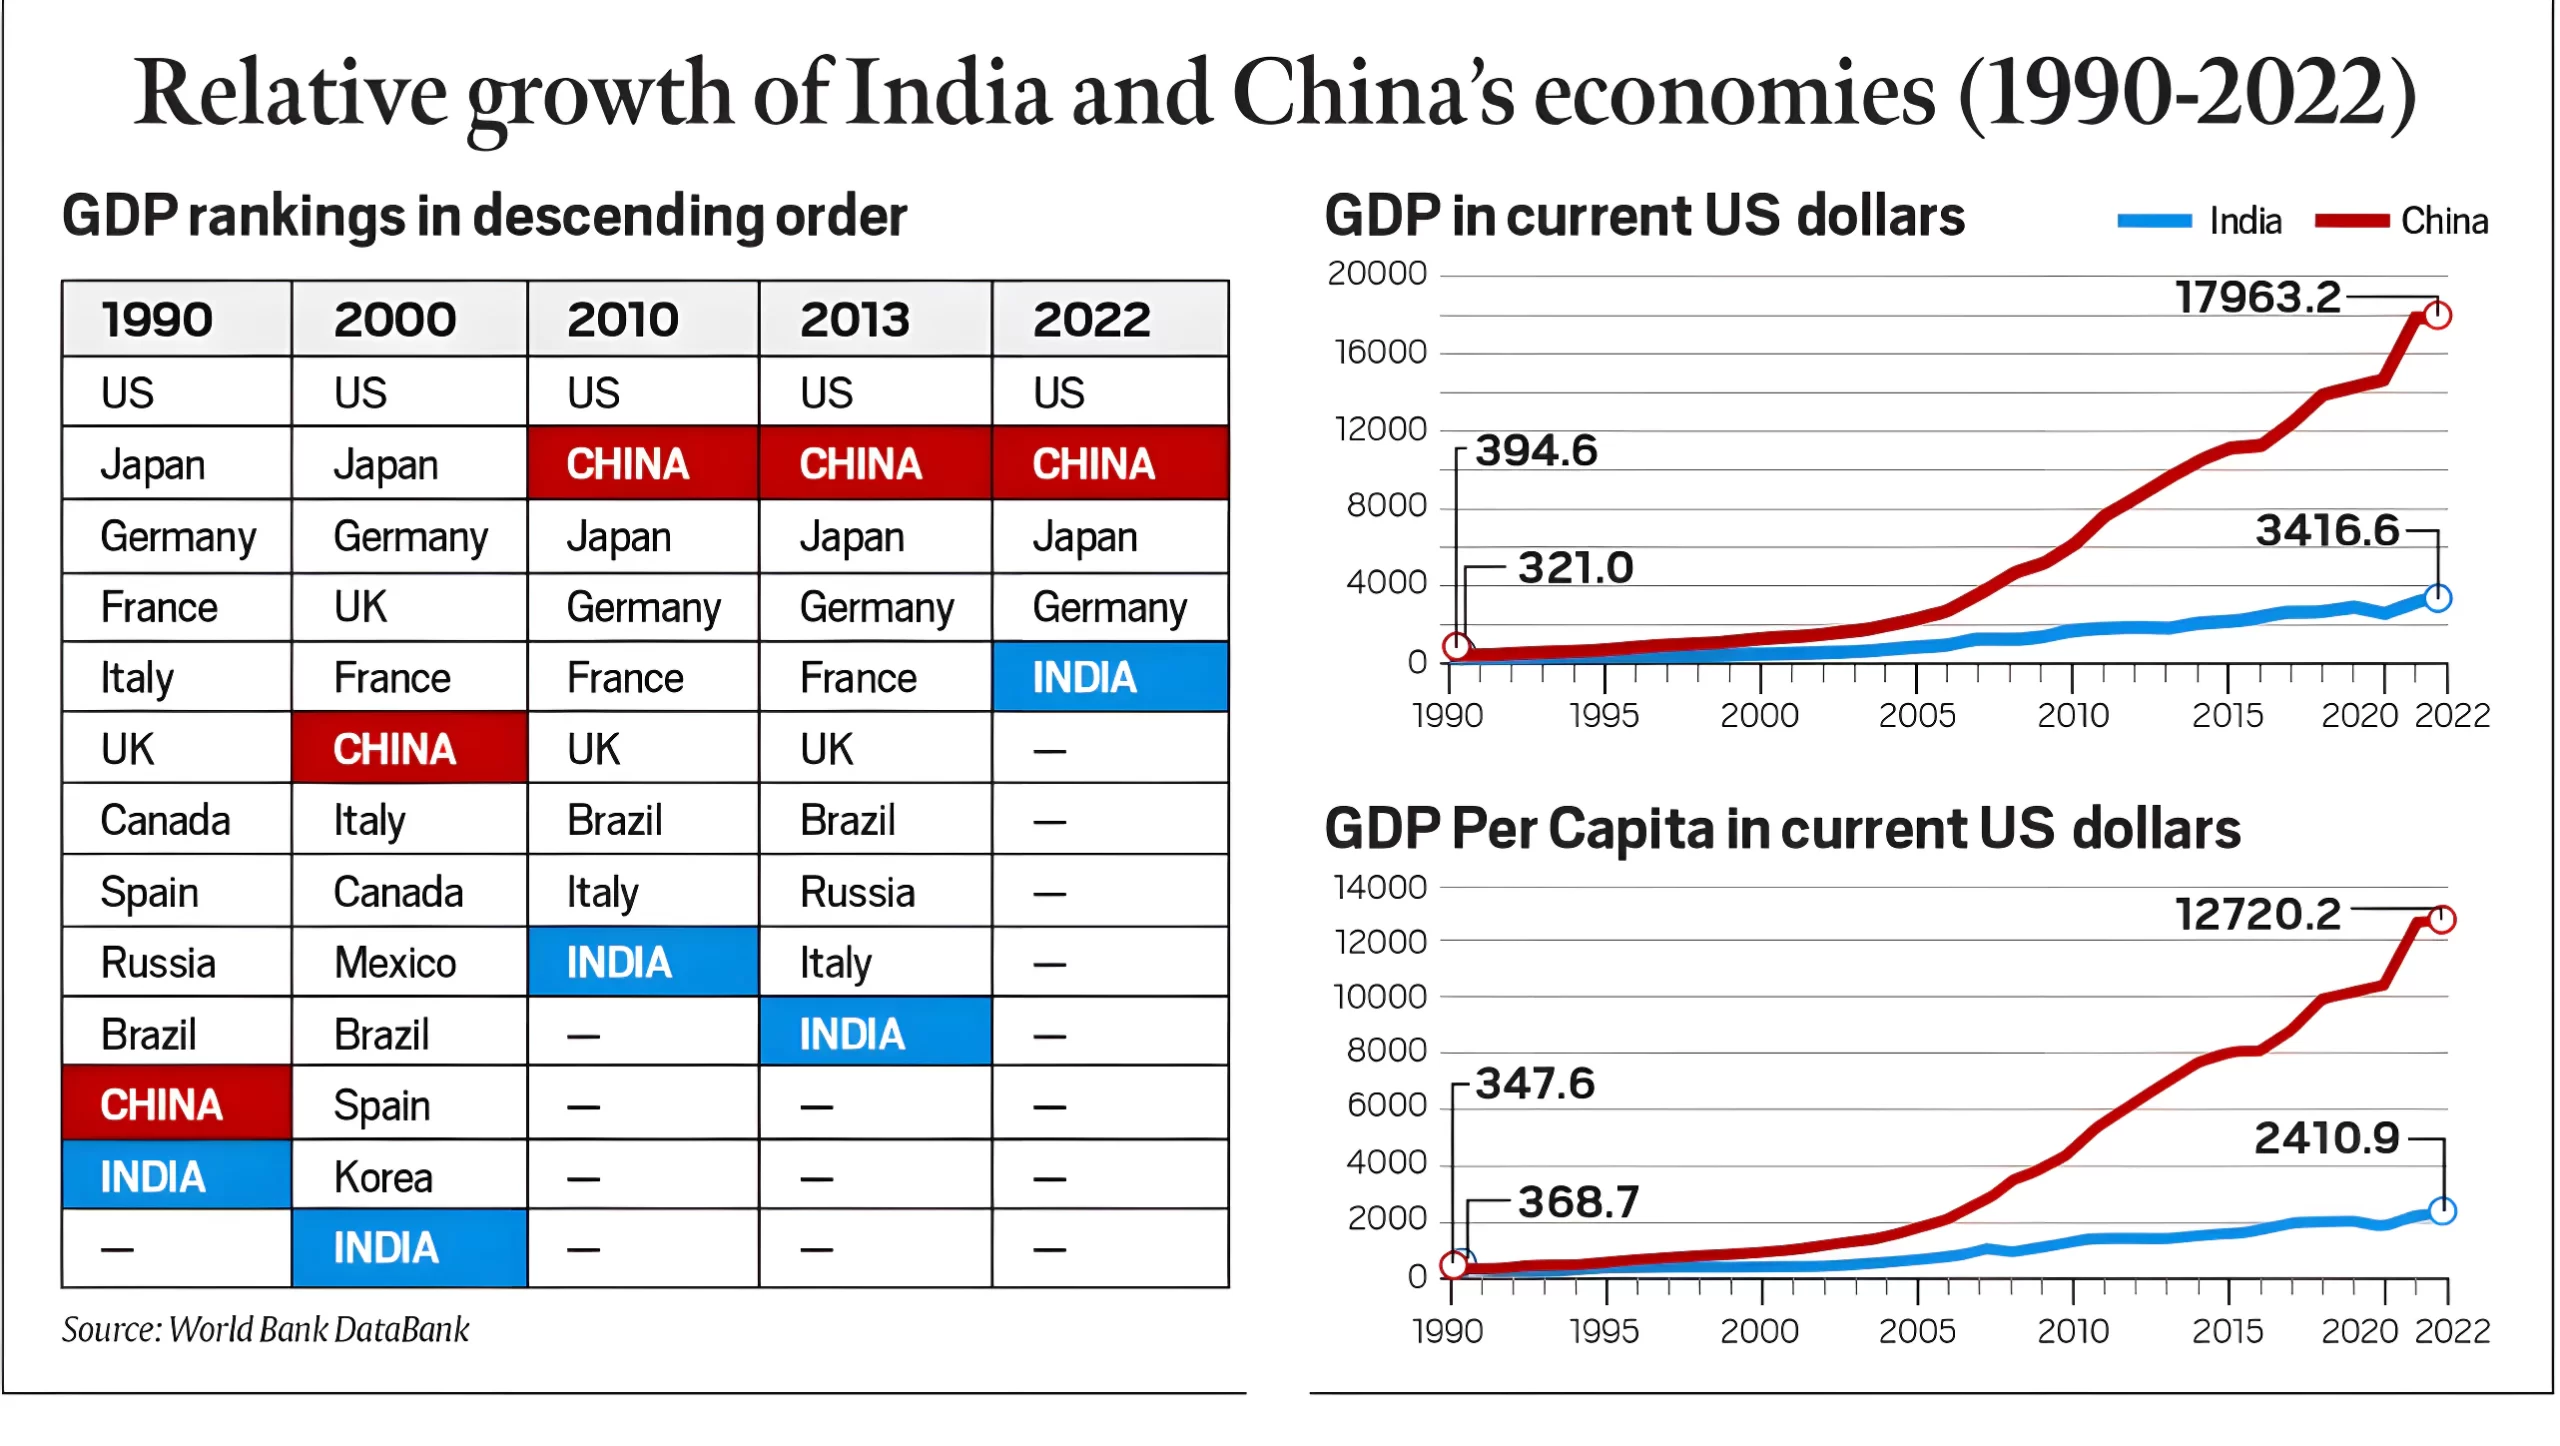
  • Nominal GDP of India: At the end of 2010, India’s nominal GDP, at $1.7 trillion, was 5.2 times its 1990 level. Yet, its world ranking, in terms of economic size, had improved only marginally from No. 12 to No. 9.

India China GDP Comparision

India China GDP Comparison

  • Widening of Gap: In 1990, China’s economy was just over 1.2 times India’s and it became 3.6 times and 5.3 times India’s in 2010 and 2022 respectively.
  • Size of Chinese Economy: The 1990s and 2000s were China’s decades. The size of its economy in 2010, measured by nominal GDP, was already larger than that of the US in 1990.
  • Growth Rate of India during 1990-2022: India has witnessed such a transformation with an average annual real GDP growth of 6% during 1990-2022.
  • Growth Rate of China During Same period: China’s average of 8.9% over the same 33-year-period.
  • Increase in Per Capita GDP of China: The Chinese story has been accompanied by an increase in per capita GDP from $348 (less than India’s $369) to $12,720 (far more than India’s $2,411) during this period. 

Conclusion

At current per capita GDP levels, India currently falls within the category of “lower-middle income” countries ($1,136 to $4,465) and China is classified as an “upper-middle income” country ($4,466 to $13,845). To reach the status of a developed country ($13,846 or higher), is a goal worth striving for.

Also Read: Declining China GDP: How Can It Benefit India?


Prelims PYQ (2015):

A decrease in tax to GDP ratio of a country indicates which of the following? 

1. Slowing economic growth rate 

2. Less equitable distribution of national income Select the correct answer using the codes given below. 

(a) 1 only 

(b) 2 only 

(c) Both 1and 2 

(d) Neither 1 nor 2 

Ans: (d)


Mains Question: Despite India being one of the countries of Gondwanaland, its mining industry contributes much less to its Gross Domestic Products [GDP] in percentage. Discuss. [150 Words, 10 Marks]


Must Read
NCERT Notes For UPSC UPSC Daily Current Affairs
UPSC Blogs UPSC Daily Editorials
Daily Current Affairs Quiz Daily Main Answer Writing
UPSC Mains Previous Year Papers UPSC Test Series 2024


To get PDF version, Please click on "Print PDF" button.

/*
*/

Need help preparing for UPSC or State PSCs?

Connect with our experts to get free counselling & start preparing

THE MOST
LEARNING PLATFORM

Learn From India's Best Faculty

      
Quick Revise Now !
AVAILABLE FOR DOWNLOAD SOON
UDAAN PRELIMS WALLAH
Comprehensive coverage with a concise format
Integration of PYQ within the booklet
Designed as per recent trends of Prelims questions
हिंदी में भी उपलब्ध
Quick Revise Now !
UDAAN PRELIMS WALLAH
Comprehensive coverage with a concise format
Integration of PYQ within the booklet
Designed as per recent trends of Prelims questions
हिंदी में भी उपलब्ध

<div class="new-fform">


    </div>

    Subscribe our Newsletter
    Sign up now for our exclusive newsletter and be the first to know about our latest Initiatives, Quality Content, and much more.
    *Promise! We won't spam you.
    Yes! I want to Subscribe.