NCERT NOTES

Elevate your UPSC preparation with NCERT Notes – because every word matters on your journey to success.

Analysis of Demand Dynamics: The Law of Demand, Linear Curves, and Consumer Preferences

November 29, 2023 1019 0

Impact of Prices, Tastes, and Preferences

The quantity of a commodity that a consumer is willing to buy and is able to afford is called demand for the commodity. According to the Law of Demand, This demand is mainly dependent on prices of goods, consumer’s tastes and preferences. Whenever one of these changes, the quantity of goods consumers are willing to buy also changes. 
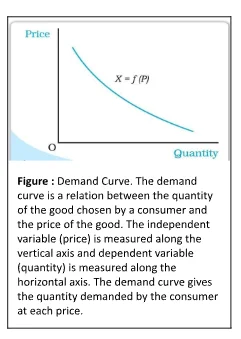
  • The consumer’s demand function is a crucial relationship between a good’s price and its quantity, which determines the optimal choice of a good. 
  • According to the Law of Demand, It can be expressed as  X = f (P), where X represents quantity and P represents price. 
  • The demand curve (Refer to Figure ) represents this relationship graphically. 
  • In general, the consumer’s demand for a good, following the Law of Demand, is negative, meaning the optimal choice increases with falling  prices and decreases with rising prices.
    Demand Curve


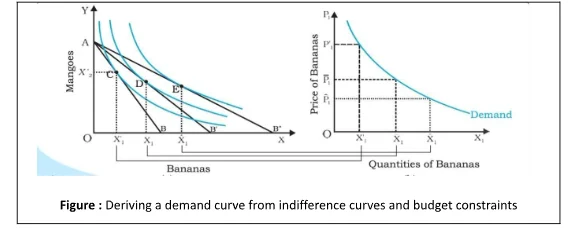
Deriving a Demand Curve from Indifference Curves and Budget Constraints: Analyzing Law of Demand

  • Practical Example: The above-mentioned Law of Demand can be understood with examples of banana consumption. 
  • The Indifference Curve at Point D: The demand for bananas, following the Law of Demand, increases as their price drops, leading to a higher indifference curve at point D in Figure.
  • A Negatively Sloped Demand Curve: This decrease in price results in an increase in banana consumption, resulting in a negatively sloped demand curve. 
  • Substitution and Income Effects: This can be explained by the substitution effect and income effect, where consumers, in adherence to the Law of Demand, maximize their utility by substituting bananas for mangoes when prices change, resulting in an increase in demand for bananas.

Deriving a Demand Curve from Indifference Curves and Budget Constraints: Analyzing Law of Demand

Deriving a Demand Curve from Indifference Curves and Budget Constraints: Analyzing Law of Demand


Law of Demand: Inverse Relationship with Price

  • Law of Demand states that other things being equal, there is a negative relation between demand for a commodity and its price. 
  • In other words, when the price of the commodity increases, demand for it falls and when the price of the commodity decreases, demand for it rises, other factors remaining the same.

Linear Demand: The Price-Quantity Relationship

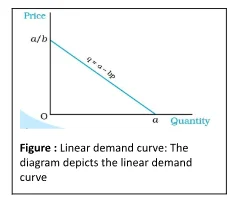
  • A linear demand curve can be written as 

Linear Demand

  • The demand curve’s slope, denoted by ‘a’, represents the change in demand with respect to price, with a unit increase in the price causing a’ b’ unit decrease in demand. 
    • This is called the Linear Demand Curve (figure ) linear demand curve

Normal and Inferior Goods: Impact on Consumer Choices

  • Normal Goods: When it comes to the majority of items, according to the Law of Demand, a consumer’s quantity preference rises as income rises and falls as income falls. 
    • These products are known as Normal goods. 
    • As a result, consumer demand for typical goods moves in the same direction as consumer income. 
  • Inferior Goods: There are some items, though, whose demand moves in the opposite direction from the consumer’s income. 
    • According to the Law of Demand, These products are known as inferior goods. 
  • Income and Consumer Preferences for Inferior Goods: Desire for inferior goods declines as consumer income rises, but desire for them increases as consumer income decreases. 
    • Examples: Inferior products include foods of poor quality, such as coarse grains.
  • Consumers Demand: 
    • Demand for normal goods increases with income,
    • While for inferior goods, it decreases. 
    • Example: At very low-income levels, demand for low-quality cereals may increase, but as income increases, consumers may switch to better-quality cereals.
  • Transition from Inferior to Normal Goods: A rise in consumer income can lead to a decrease in consumption of a good, influenced by the substitution and income effects. 
  • The Complex Case of Giffen Goods: Although the Law of Demand typically governs, The demand for such a good can be inversely or positively related to its price, such goods are called Giffen goods

Substitutes and Complements: Decoding Price Dynamics

  • Price Relationships Between Goods: The quantity of a good can increase or decrease with the price of a related good which may be complementary or substitute for each other. 
  • Complementary Goods and Inverse Price Relationships: These are those which are consumed together such as tea and sugar, pen and ink etc. 
    • For complementary goods, an increase in the price of one causes a decrease in demand for another.
    • For instance, an increase in the price of sugar will lead to a decrease in demand for tea and vice versa. 
    • Hence, demand for goods moves in the opposite direction of the price of their complementary goods. 
  • Substitute Goods and Price-Quantity Dynamics: Goods like tea and coffee, are not consumed together. 
    • If the price of tea increases, customers can shift to coffee. 
    • Hence, in case of an increase in the price of one good, customers can shift to its substitutes, which may increase their demand and subsequently price of the substitute. 
    • Thus, the demand for a good usually moves in the direction of the price of its substitutes.

Shifts in the Demand Curve: Income, Prices, and Preferences

  • The demand curve , based on the Law of Demand, illustrates how consumer preferences and income affect the demand for goods. 
  • Factors Influencing the Demand Curve:
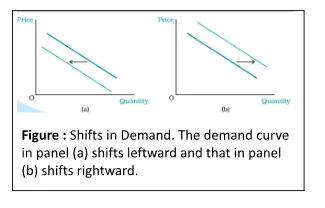
  • Income’s Impact on the Demand Curve: When income increases, the demand for normal goods shifts rightward, while for inferior goods, it shifts leftward (Refer to Figure). Shifts in the Demand Curve
  • Price of Related Goods and Demand Fluctuations: Conversely, when the price of a related good changes, the demand for a good at each level changes. 
  • Consumer Preferences: The demand curve can also shift due to consumer preferences, such as increasing preference for ice creams in summer or revealing health risks to cold drinks, resulting in a leftward shift. 
  • Non Price Factors: These shifts occur when factors other than the commodity’s price change.

Movements along the Demand Curve and Shifts in the Demand Curve: Price Movements and Curve Shifts

  • Determinants of Consumer Choice: It depends on the price of goods, other goods, income, and preferences. 
  • The Demand Function:  It represents the relationship between the amount of a good and its price (figures). 
  • Price Change and Shifts: The demand curve shows price changes leading to movement along the curve, while other changes cause a shift.


Need help preparing for UPSC or State PSCs?

Connect with our experts to get free counselling & start preparing

THE MOST
LEARNING PLATFORM

Learn From India's Best Faculty

      
Quick Revise Now !
AVAILABLE FOR DOWNLOAD SOON
UDAAN PRELIMS WALLAH
Comprehensive coverage with a concise format
Integration of PYQ within the booklet
Designed as per recent trends of Prelims questions
हिंदी में भी उपलब्ध
Quick Revise Now !
UDAAN PRELIMS WALLAH
Comprehensive coverage with a concise format
Integration of PYQ within the booklet
Designed as per recent trends of Prelims questions
हिंदी में भी उपलब्ध

<div class="new-fform">


    </div>

    Subscribe our Newsletter
    Sign up now for our exclusive newsletter and be the first to know about our latest Initiatives, Quality Content, and much more.
    *Promise! We won't spam you.
    Yes! I want to Subscribe.