Win up to 100% Scholarship

Register Now

NCERT NOTES

Elevate your UPSC preparation with NCERT Notes – because every word matters on your journey to success.

Firm Supply Curves: Short-Run, Long-Run, and Profitability Analysis

December 1, 2023 402 0

Firm Supply Curves: Quantity Choices, Prices, and Graphical Insights

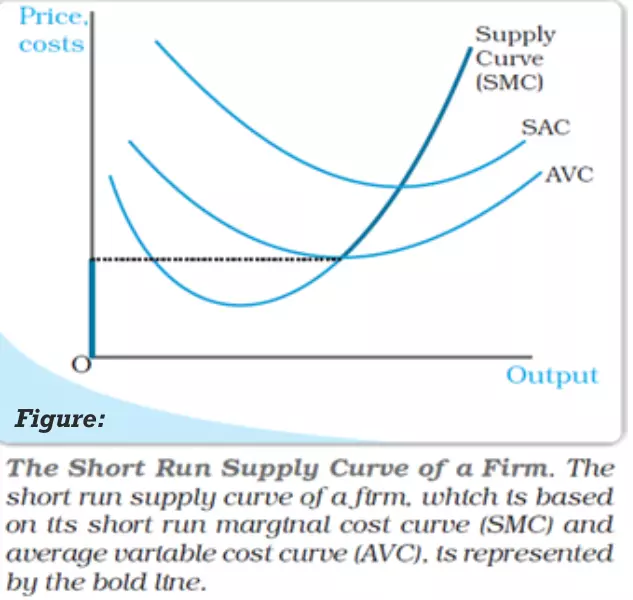
A firm supply refers to the quantity it opts to sell at a specified price, given the technology and the prices of production factors.

  • Supply Schedule: It is a table delineating the quantities a firm sells at various prices, with technology and prices of production factors held constant.
  • Supply Curve: It is a graphical representation of the supply schedule. 
  • It displays the levels of output (plotted on the x-axis) that the firm decides to produce, corresponding to different market prices (plotted on the y-axis), with technology and prices of production factors remaining unchanged.

Firm’s Supply Curves: Distinguishing Between Short Run and Long Run Supply Curves

  • The supply curve is bifurcated into short-run and long-run supply curves, catering to different time horizons. 

Short-Run Supply Curve: Derivation and Price-AVC Scenarios

  • The derivation of a firm’s short-run supply curve is illustrated in Figure.
  • It is dissected into two scenarios based on the relationship between the market price and the minimum Average Variable Cost (AVC).

market price value

Case 1 Profit Max: Short-Run Supply Curve Analysis

  • In this scenario, the market price, denoted as p1​, is greater than or equal to the minimum AVC.
  • Profit Max Analysis: Derivation Process
    • Equating p1 with (SMC): Initially, p1​ is equated with the Short Run Marginal Cost (SMC) on the ascending segment of the SMC curve, leading to the identification of output level q1​.
    • Q1 Profit Maximization : AVC Below Price Ensures Short-Run Success
      • It’s observed that at q1​, the AVC does not surpass the market price p1​, aligning with the conditions outlined in previous cases for profit maximisation.
      • Therefore, with the market price at p1​, the firm’s short-run output level is established as q1​, satisfying all the requisite conditions for profit maximization in the short run.

Case 2 Analysis: Price < AVC, Zero Output for Short-Run Feasibility

  • In this scenario, the market price, denoted as p2, is less than the minimum Average Variable Cost (AVC).
  • Short-Run Feasibility: Profit Conditions, AVC, and Zero Outpu
    • Profit-Maximizing Condition in the Short Run: As per above condition, for a profit-maximizing firm to produce a positive output in the short run, the market price as p2​, must be greater than or equal to the AVC at that output level.
    • Firm’s Feasibility in the Short Run: However, Figure 4.7 reveals that for all positive output levels, the AVC strictly surpasses p2​, implying that it’s not feasible for the firm to supply a positive output.
    • Zero Output Choice: Consequently, with the market price at p2​, the firm opts for zero output.

Short-Run Supply Curve: Combining Cases for Insightful Curve Analysis

  • Integrating the insights from both cases leads to a significant conclusion regarding the firm’s short-run supply curve.
  • Short-Run Supply Curve: The firm’s short-run supply curve comprises the ascending segment of the Short Run Marginal Cost (SMC) curve from and above the minimum AVC, coupled with zero output for all prices strictly below the minimum AVC.
    • In Figure, the bold line delineates the short-run supply curve of the firm, encapsulating the derived relationship between market price, AVC, and the firm’s output level in the short run.

Short-Run Supply Curve

Long Run Supply Curve of a Firm: LRAC Analysis for Price Dynamics

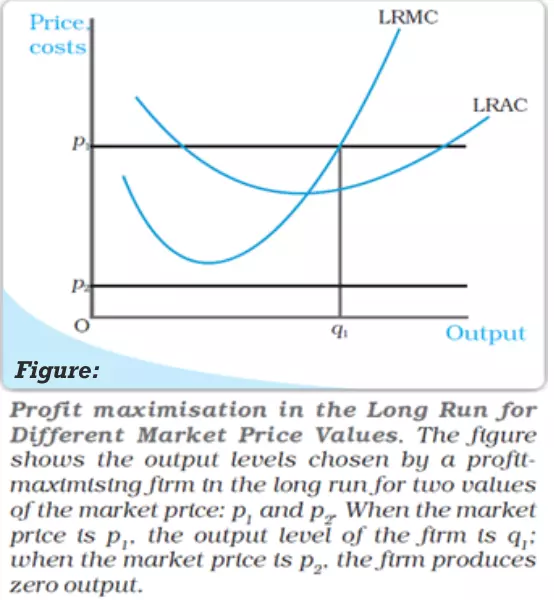
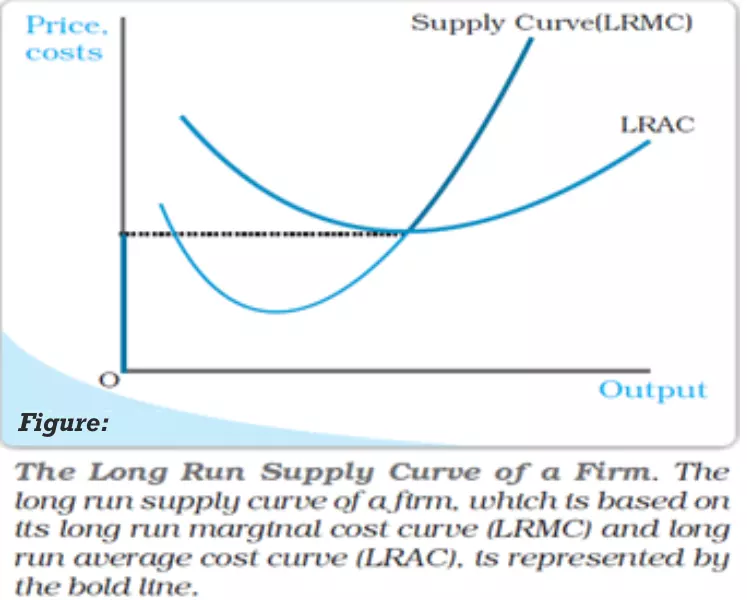
The derivation of a firm’s long-run supply curve is illustrated in Figure and is dissected into two scenarios based on the relationship between the market price and the minimum Long Run Average Cost (LRAC).

Long Run Supply Curve of a Firm

Case 1 LRAC Analysis: Profitable Long-Run Output Dynamics

In this scenario, the market price, denoted as p1​, is greater than or equal to the minimum LRAC.

  • LRMC Derivation: Output Determination and Profit Maximization
      • Determining Output Level: Initially, p1​ is equated with the Long Run Marginal Cost (LRMC) on the ascending segment of the LRMC curve, leading to the identification of output level q1​.
      • Profit Maximization Conditions: It’s observed that at q1​, the LRAC does not surpass the market price p1​, aligning with the conditions outlined in previous discussions for profit maximization.
  • Case 1 Conclusion: LRAC, LRMC, and Long-Run Output Dynamics
    • Therefore, with the market price at p1​, the firm’s long-run output level is established as q1​, satisfying all the requisite conditions for profit maximisation in the long run.
    • The long-run supply curve of a firm is crucially dependent on the interplay between market price, LRAC, and LRMC.
    • Figure 4.9 aids in visually understanding the derivation process and the conditions under which the firm decides its output level in the long run, particularly when the market price is favourable compared to the minimum LRAC. 

Case 2: Price < Minimum LRAC

In this scenario, the market price, denoted as p2​, is less than the minimum Long Run Average Cost (LRAC). 

  • Analysis
    • Profit-Maximizing in the Long Run: According to previous discussions, for a profit-maximizing firm to produce a positive output in the long run, the market price, p2​, must be greater than or equal to the LRAC at that output level.
    • Firm’s Feasibility in the Long Run: However, Figure 4.9 reveals that for all positive output levels, the LRAC strictly surpasses p2​, implying that it’s not feasible for the firm to supply a positive output.
    • Zero output Choice: Consequently, with the market price at p2​, the firm opts for zero output.

Cases 1 & 2 Integration: Key Insights on Long-Run Supply

Integrating the insights from both cases leads to a significant conclusion regarding the firm’s long-run supply curve.

Long-Run Conclusion: LRAC, LRMC, and Firm’s Supply Dynamics

Long Run Supply Curve of a Firm

  • Long-Run Supply Curve: The firm’s long-run supply curve comprises the ascending segment of the long-run marginal Cost (LRMC) curve from and above the minimum LRAC, coupled with zero output for all prices strictly below the minimum LRAC.
  • In Figure, the bold line delineates the long-run supply curve of the firm, encapsulating the derived relationship between market price, LRAC, and the firm’s output level in the long run.

Shutdown Points: Key Deciders in Short and Long-Run Viability

The concept of the shutdown point is crucial in understanding a firm’s decision to continue production or halt it based on the prevailing market price and cost condition.

Short-Run Production: Finding the Shutdown Point Dynamics

  • Short Run Production: A firm will continue to produce as long as the market price is greater than or equal to the minimum of the Average Variable Cost (AVC).
  • Point of Positive Output in Short Run: The last price-output combination at which the firm produces positive output, as we traverse down the supply curve, is where the Short Run Marginal Cost (SMC) curve intersects the AVC curve at the minimum of AVC.
  • Establishing the Shutdown Point: This specific point is termed the short-run shutdown point of the firm, beyond which the firm ceases production as it becomes unviable.

Long-Run Shutdown: LRAC Determination for Viability Check

  • Determination Long-Run Shutdown Point: In the long run, the shutdown point shifts and is determined by the minimum of the Long Run Average Cost (LRAC) curve.
  • Viability Assessment: This reflects the firm’s assessment of long-term viability, where it will cease production if the market price falls below the minimum of LRAC.

Shutdown Points’ Significance: Key Insights for Firm Strategy

  • Variation in Shutdown Points: The shutdown point is a critical indicator of a firm’s threshold for continuing production, which varies between the short run and the long run due to the differing cost structures and market conditions.
  • Significance of the Shutdown Point: Understanding the shutdown point is essential for analysing a firm’s supply behaviour and its response to market price fluctuations over different time horizons.

Profit Essentials: Normal, Super-Normal, and Break-even Insights

Normal Profit: Essential for Firm Sustainability and Viability

  • Definition: It is defined as the minimum level of profit necessary to keep a firm operational in its current business.
  • Essentiality of Normal Profit: Key to Firm Sustainability
    • It’s crucial for a firm’s sustainability; without achieving normal profits, a firm is unlikely to continue its operations.
    • Normal profits are considered a part of the firm’s total costs, representing an opportunity cost for entrepreneurship.

Super-Normal Profit: Elevating Profitability Beyond Sustainability

  • Definition: Any profit earned over and above the normal profit is termed as super-normal profit.
  • Significance: This extra profit signifies a firm’s enhanced profitability beyond just sustaining its operations.

Profitability Choices: Long Run vs. Short Run Strategies

  • Long-Run Production Decision: In the long run, a firm will cease production if it earns anything less than the normal profit, emphasizing long-term sustainability.
  • Short-Run Production Decision: In the short run, a firm may continue to produce even if the profits are below the normal profit level, indicating short-term operational flexibility.

Break-even Point: Balancing Profit and Loss on the Curve

  • Definition: The break-even point is a critical juncture on the supply curve where a firm earns only normal profit, neither gaining nor losing.
  • Identification of Output Point: It’s identified at the point of minimum average cost where the supply curve intersects the Long Run Average Cost (LRAC) curve, or the Short Run Average Cost (SAC) curve in the short-run scenario.

Profit Essentials: Takeaways for Financial Health and Viability

  • Understanding the concepts of normal profit and super-normal profit is essential for analyzing a firm’s financial health and sustainability.
  • The break-even point serves as a benchmark for evaluating a firm’s profitability and determining its operational viability in both short and long-term scenarios.
  • These concepts are graphically represented on the firm’s supply curve, providing a visual insight into the firm’s profitability dynamics.

Opportunity Cost

  • Opportunity cost is a fundamental concept in economics representing the benefits foregone from the next best alternative activity when a particular decision is made.

Illustration of Opportunity Cost

  • In the given scenario, you have Rs 1,000 at your disposal which you choose to invest in your family business.
  • The alternative uses of this money could be:
  • Keeping it in a house-safe yielding zero return.
  • Depositing it in bank-1 to earn an interest of 10%.
  • Depositing it in bank-2 to earn an interest of 5%.

Calculating Opportunity Cost

  • The highest possible benefit from the alternative activities is the 10% interest that could be earned from depositing the money in bank-1.
  • Once the decision to invest in the family business is made, this opportunity to earn 10% interest is foregone.
  • Therefore, the opportunity cost of investing Rs 1,000 in the family business is the amount of interest that could have been earned from bank-1.

 Final Result – CIVIL SERVICES EXAMINATION, 2023.   Udaan-Prelims Wallah ( Static ) booklets 2024 released both in english and hindi : Download from Here!     Download UPSC Mains 2023 Question Papers PDF  Free Initiative links -1) Download Prahaar 3.0 for Mains Current Affairs PDF both in English and Hindi 2) Daily Main Answer Writing  , 3) Daily Current Affairs , Editorial Analysis and quiz ,  4) PDF Downloads  UPSC Prelims 2023 Trend Analysis cut-off and answer key

THE MOST
LEARNING PLATFORM

Learn From India's Best Faculty


 Final Result – CIVIL SERVICES EXAMINATION, 2023.   Udaan-Prelims Wallah ( Static ) booklets 2024 released both in english and hindi : Download from Here!     Download UPSC Mains 2023 Question Papers PDF  Free Initiative links -1) Download Prahaar 3.0 for Mains Current Affairs PDF both in English and Hindi 2) Daily Main Answer Writing  , 3) Daily Current Affairs , Editorial Analysis and quiz ,  4) PDF Downloads  UPSC Prelims 2023 Trend Analysis cut-off and answer key

Quick Revise Now !
AVAILABLE FOR DOWNLOAD SOON
UDAAN PRELIMS WALLAH
Comprehensive coverage with a concise format
Integration of PYQ within the booklet
Designed as per recent trends of Prelims questions
हिंदी में भी उपलब्ध
Quick Revise Now !
UDAAN PRELIMS WALLAH
Comprehensive coverage with a concise format
Integration of PYQ within the booklet
Designed as per recent trends of Prelims questions
हिंदी में भी उपलब्ध

<div class="new-fform">


    </div>

    Subscribe our Newsletter
    Sign up now for our exclusive newsletter and be the first to know about our latest Initiatives, Quality Content, and much more.
    *Promise! We won't spam you.
    Yes! I want to Subscribe.