NCERT NOTES

Elevate your UPSC preparation with NCERT Notes – because every word matters on your journey to success.

Equilibrium Price: How Free Entry and Exit for Market Stability?

December 5, 2023 1296 0

Market Equilibrium: Free Entry, Exit, and Stable Prices

Earlier, market equilibrium was explored with a fixed number of firms. Now market equilibrium price will be delved into when firms can freely enter and exit the market, assuming all firms are identical.

The implication of this entry and exit assumption is that in equilibrium price, no firm will earn a supernormal profit (profits exceeding the normal rate of return) or incur losses while staying in production. The equilibrium price will equal the minimum average cost of the firms.

Supernormal Profit Scenario: The Rise and Fall of Supernormal Profits

  • Attractive Prospect for New Firms: If, at the current market price, each firm is making supernormal profits, this attractive prospect will draw new firms into the market.
  •  Supply Curve Shifts Rightward: As these new firms enter, the market supply curve shifts rightward.
  • Decline in Market Price: However, the demand remains unchanged. This influx of supply leads to a decline in market price.
  • Supernormal Profit Disappear: As prices drop, supernormal profits gradually disappear. At this point, with all firms in the market making only normal profits (the minimum required to cover costs), there’s no longer an incentive for more firms to enter.

Below Normal Profit Scenario: Market Exits, Price Rises, and Profit Resurgence

  • Less than Normal Profit: If firms are earning less than normal profit at the current price, some firms will exit the market.
  • Increase in Market Price: This reduction in the number of firms increases the market price.
  • Higher Profits: With fewer firms, the remaining ones can now earn higher profits, eventually reaching the level of normal profit.
  • Normal Profit: Once again, no firm will want to leave, as they are earning normal profit at this point.

Hence, with the freedom for firms to enter and exit, each firm in the market will always earn normal profit at the prevailing market price. This dynamic ensures that firms are neither earning excessive profits nor suffering losses in the long run.
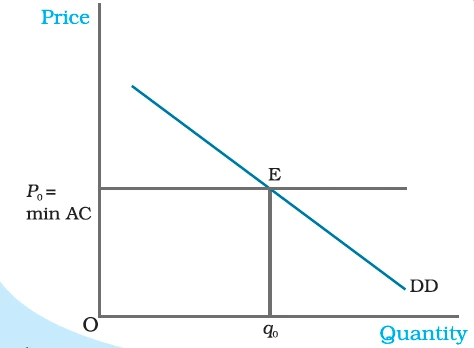
Price Determination with Free Entry and Exit.

Price Determination with Free Entry and Exit.

With free entry and exit in a perfectly competitive market, the equilibrium price is always equal to min AC and the equilibrium quantity is determined at the intersection of the market demand curve DD with the price line p = min AC.

Equilibrium in a Market: Free Entry and Exit of Firms

  • As discussed earlier, firms experience supernormal profits when prices exceed their minimum average costs and below-normal profits when prices fall below this cost threshold.
  • Entry and Exit of Firms: Consequently, when prices are higher than the minimum average cost, new firms are incentivized to enter the market, while existing firms consider exiting when prices dip below this level.
  • Normal Profits: At the specific price where firms earn normal profits, there’s no motivation for new firms to enter, and those currently operating remain in the market since they aren’t incurring losses.
  • This price level becomes the prevailing market price.
  • Therefore, the concept of firms freely entering and exiting implies that the market price always equals the minimum average cost, represented as:

p = min AC

  • Equilibrium Scenario: The quantity supplied aligns with market demand at this price, ensuring they are equal. 
    • Graphically, this equilibrium price is illustrated in Figure, where the market achieves balance at point E. Here, the demand curve DD intersects with the line representing:

p0 = min AC

  • This results in the market price p0 and a total quantity demanded and supplied equal to q0.
  • At p0 = min AC each firm supplies the same amount of output, say q0f. Therefore, the equilibrium price of firms in the market is equal to the number of firms required to supply q0 output at p0, each in turn supplying q0f amount at that price. 
  • If we denote the equilibrium price of firms by n0, then

n0 = q0/q0f

To understand the equilibrium price and quantity determination more clearly, let us look at the following example:

  • Example: Consider the example of a market for wheat such that the demand curve for wheat is given as follows

qD = 200 – p for 0 p 200

      = 0 for p > 200

  • Assume that the market consists of identical firms. The supply curve of a single firm is given by

qfs = 10 + p for p 20

for 0 p 20

  • The free entry and exit of firms would mean that the firms will never produce below minimum average cost because otherwise they will incur loss from production in which case they will exit the market.
  • As we know, with free entry and exit, the market will be in equilibrium at a price which equals the minimum average cost of the firms. Therefore, the equilibrium price is

p0 = 20

  • At this price, the market will supply that quantity which is equal to the market demand. Therefore, from the demand curve, we get the equilibrium quantity:

q0 = 200 – 20 = 180

  • Also at p0 = 20, each firm supplies

q0 = 10 + 20 = 30

  • Therefore, the equilibrium number of firms is

n0 = q0/q0f= 180 / 30 = 6

  • Thus, with free entry and exit, the equilibrium price, quantity and number of firms are Rs 20, 180 kg and 6 respectively.

Shifts in Demand: Impact on Price and Quantity in a Flexible Market
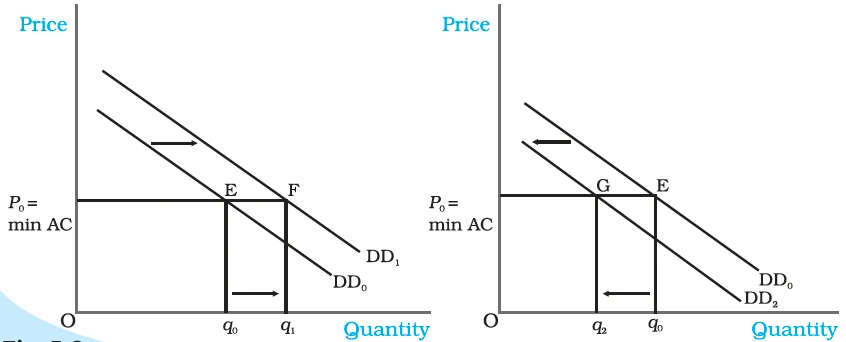
  • Impact of Shift in Demand: Let’s explore how a shift in demand affects equilibrium price and quantity in a market where firms can freely enter and exit.
  • Equilibrium Price and Minimum Average Cost: In this setting, the equilibrium price always matches the minimum average cost of existing firms, ensuring price stability.

Shifts in Demand

Shifts in Demand

Initially, the demand curve was DD0, the equilibrium quantity and price were q0 and p0 respectively. With rightward shift of the demand curve to DD1, as shown in panel (a), the equilibrium quantity increases and with leftward shift of the demand curve to DD2, as shown in panel (b), the equilibrium quantity decreases. In both the cases, the equilibrium price remains unchanged at p0.

  • Initial Equilibrium: At point E, demand curve DD0 intersects the p0 = minAC line, resulting in equilibrium price p0 and quantity q0, with n0 firms.
  • Rightward Demand Shift: Equilibrium Price and Competition
    • If demand shifts rightward, creating excess demand, prices rise, attracting new firms.
    • Competition brings prices back to p0, but with increased supply, we reach a new equilibrium (p0, q1), where p0 > q0, and n1 firms due to new entries.
  • Leftward Demand Shift: Demand Declines, Equilibrium  Prices, and Firms Exit
    • A leftward demand shift leads to excess supply, causing price drops and some firms to exit.
    • Prices stabilize at p0, but the equilibrium quantity decreases to q2, with n2 firms as some exit.
  • Key Difference: How Shifting Demand Shapes Quantity, Not Price?

Unlike a fixed-firm scenario, shifts in demand have a more significant impact on quantity but no effect on equilibrium price when firms can freely enter and exit.


Need help preparing for UPSC or State PSCs?

Connect with our experts to get free counselling & start preparing

Aiming for UPSC?

Download Our App

      
Quick Revise Now !
AVAILABLE FOR DOWNLOAD SOON
UDAAN PRELIMS WALLAH
Comprehensive coverage with a concise format
Integration of PYQ within the booklet
Designed as per recent trends of Prelims questions
हिंदी में भी उपलब्ध
Quick Revise Now !
UDAAN PRELIMS WALLAH
Comprehensive coverage with a concise format
Integration of PYQ within the booklet
Designed as per recent trends of Prelims questions
हिंदी में भी उपलब्ध

<div class="new-fform">


    </div>

    Subscribe our Newsletter
    Sign up now for our exclusive newsletter and be the first to know about our latest Initiatives, Quality Content, and much more.
    *Promise! We won't spam you.
    Yes! I want to Subscribe.