Udaan, Prahaar, Q&A Bank etc.
CA Magazines & Editorials
 December 5, 2023
Market Dynamics: Factors Shaping Prices and Quantities
Examination of market equilibrium assumes that consumer preferences, prices of related goods, consumer incomes, technology, market size, input prices, and more remain unchanged.
However, alterations in these factors can lead to shifts in either the supply curve, the Shift in Demand Curve, or both, consequently influencing equilibrium price and quantity.
Shift in Demand Curve: Impact on Price and Quantity in Markets
|
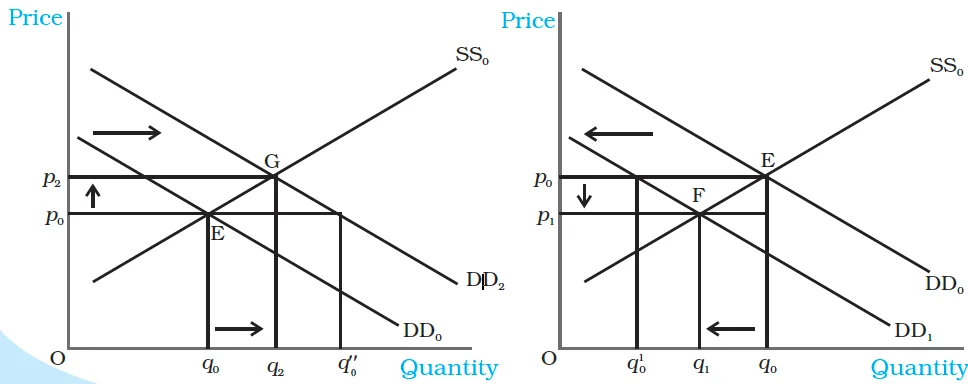
Figure : Shifts in Demand. Initially, the market equilibrium is at E. Due to the shift in demand to the right, the new equilibrium is at G as shown in panel (a) and due to the leftward shift, the new equilibrium is at F, as shown in panel (b). With rightward shift the equilibrium quantity and price increase whereas with leftward shift, equilibrium quantity and price decrease. |
|---|
Having established the general theory, let’s examine how changes in specific factors affect the Shift in Demand Curve, equilibrium quantity, and price.
Changes in specific factors affecting demand curve, equilibrium quantity, and price

|
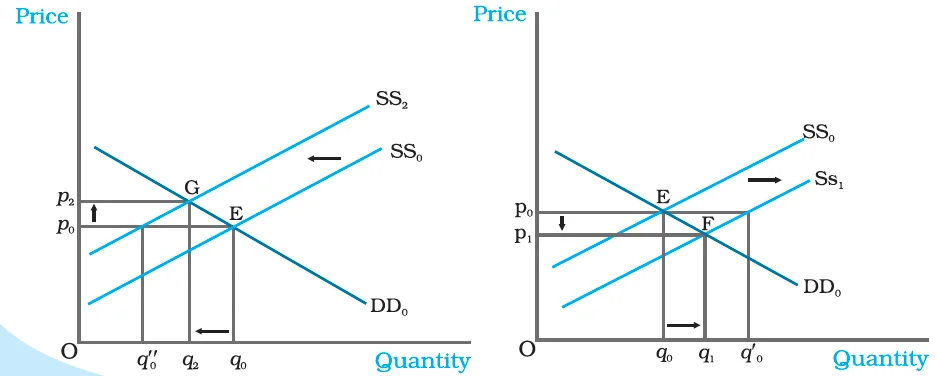
Figure : Shifts in Supply. Initially, the market equilibrium is at E. Due to the shift in supply curve to the left, the new equilibrium point is G as shown in panel (a) and due to the rightward shift the new equilibrium point is F, as shown in panel (b). With rightward shift, the equilibrium quantity increases and price decreases whereas with leftward shift, equilibrium quantity decreases and price increases. |
|---|
Now, let’s analyze the effects of increase in input price and increase in number of firms in the market:
Changes in specific factors affecting supply curve, equilibrium quantity, and price:
Increase in Input Price:
Simultaneous shifts in both supply and Shift in Demand Curve can occur in four possible ways:
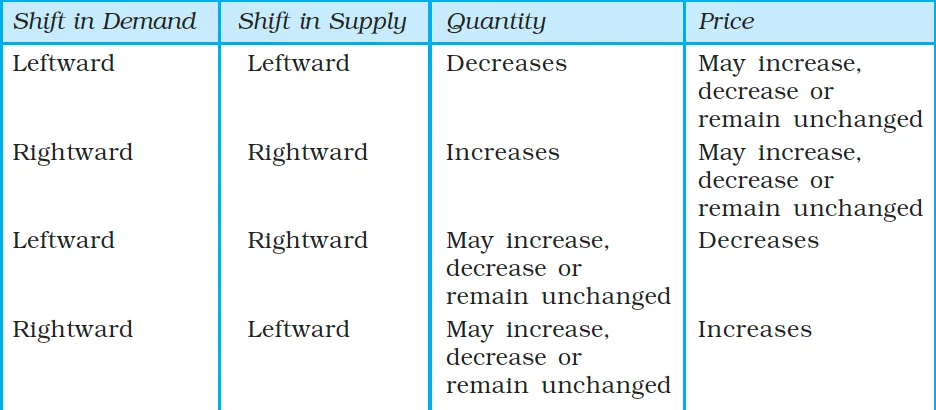
Impact of Simultaneous Shifts on Equilibrium
|
Figure : Simultaneous Shifts in Demand and Supply. Initially, the equilibrium is at E where the demand curve DD0 and supply curve SS0 intersect. In panel (a), both the supply and the demand curves shift rightward leaving price unchanged but a higher equilibrium quantity. In panel (b), the supply curve shifts rightward and demand curve shifts leftward leaving quantity unchanged but a lower equilibrium price. |
|---|
Explore SRIJAN Program


Connect with our experts to get free counselling & start preparing
Join India’s trusted platform for expert guidance, quality content, proven success.
Learn anytime, anywhere.


India's leading UPSC coaching platform helping aspirants prepare for IAS, IPS, IFS and other Civil Services examinations with the best faculty and proven strategies.
<div class="new-fform">
</div>