Win up to 100% Scholarship

Register Now

NCERT NOTES

Elevate your UPSC preparation with NCERT Notes – because every word matters on your journey to success.

Market Equilibrium: Balancing Demand and Supply for Economic Stability

November 30, 2023 414 0

Market Equilibrium: Demand, Supply, and Practical Insights

In this chapter, a combination of  consumer and firm  is used to analyze market equilibrium through demand and supply analysis. The price at which equilibrium occurs will be determined and the impacts of shifts in demand and supply on this equilibrium will be investigated. Additionally, Practical applications of demand and supply analysis will be examined.

Revisiting of Curves from Previous Chapters

Individual demand curves: It shows how much a consumer is willing to buy at different prices.

The market demand curve: It shows the total quantity consumers are willing to purchase at various prices. 

Individual firm supply curves: It indicates how much a profit-maximising firm wants to sell at different prices. 

The market supply curve: It reflects the total quantity all firms wish to supply at various prices.

Market Equilibrium, Excess Demand, Excess Supply: Balancing Act

  • In a competitive market equilibrium, both buyers and sellers pursue self-interested goals. Consumers aim to maximise their preferences, while firms seek to maximise profits. Importantly, these objectives align in market equilibrium.
  • Equilibrium: It occurs when all plans of all consumers and firms coincide, resulting in a market-clearing state.
    • This means that the quantity all firms want to sell equals the quantity all consumers want to buy, making market supply equal to market demand.
    • The price at which this market equilibrium is reached is the market equilibrium price, and the corresponding quantity bought and sold is the market equilibrium quantity.
    • Therefore, (p*, q*) is an equilibrium if,

qD(p*)= qS(p*)

where p* is the equilibrium price, and qD(p*) and qS(p*) represent market demand and market supply at price p*.

  • Excess Supply: When market supply surpasses market demand at a price,.
  • Excess Demand: If market demand exceeds market supply at a price.
  • Therefore, an alternative definition of equilibrium in a perfectly competitive market is the absence of excess demand or excess supply.
  • A Lack of Equilibrium: It is a condition where market equilibrium supply doesn’t equal market demand. Here there’s a tendency for the price to change.

Out-of-equilibrium Behaviour: Guiding Markets to Balance Over Time

  • Invisible Hand: Throughout the history of economics, starting with Adam Smith (1723-1790), it has been argued that in a perfectly competitive market, an “Invisible Hand” operates to adjust prices whenever there is an imbalance.
  • Role of Invisible Hand: Common intuition suggests that this “Invisible Hand” should raise prices when there is excess demand and lower prices when there is excess supply.
  • In the analysis, the concept of this “Invisible Hand” is maintained, by  assuming that it effectively guides the market equilibrium by making these price adjustments.


Market Equilibrium with Fixed Firms: Balancing Supply and Demand

Market Equilibrium with Fixed Firms

  • Analyzing Market Equilibrium: Market demand and supply curves will be used to examine how supply and demand interact to determine market equilibrium when the number of firms is fixed.
  • Figure depicts a perfectly competitive market with a fixed number of firms.
  • Supply Curve: The market supply curve (SS) shows firms’ desired supply at various prices,
  • Demand Curve: While the demand curve (DD) represents consumers’ willingness to purchase at different prices. 
  • Market Equilibrium: It occurs where these two curves intersect, signifying that market demand equals market supply.
  • At any other point, there is either excess supply or excess demand.
  • Excess Demand: If the current price is p1, market demand is q1, but market supply is only q1‘, resulting in excess demand equal to q1‘q1. 
    • This drives the price up because some consumers are willing to pay more.
    • As the price rises, quantity demanded decreases, and quantity supplied increases, gradually moving the market equilibrium at price p*.
  •  Excess Supply: If the price is p2, market supply (q1) exceeds market demand (q1), leading to excess supply of q2′q2
    • To sell their desired output, some firms lower their prices.
    • As the price falls, quantity demanded rises, and quantity supplied decreases until market equilibrium is reached at price p*, where market demand matches market supply, resulting in an equilibrium price p* and the equilibrium quantity is q*.

Let us consider the example of a market consisting of identical farms producing the same quality of wheat,

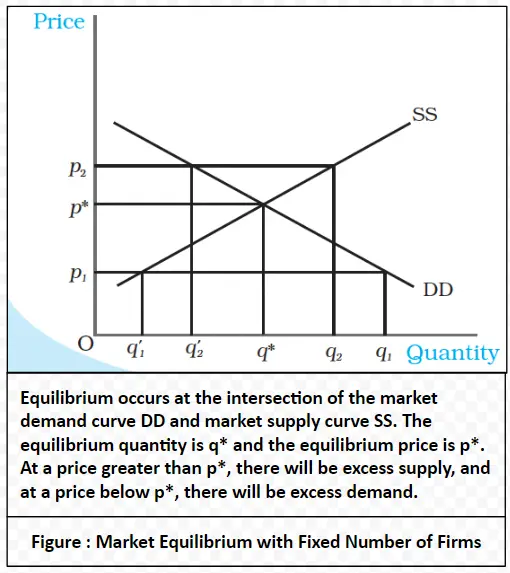
Example: Suppose the market equilibrium demand curve and the market supply curve for wheat are given by:

qD = 200 – p for 0 p 200

      = 0 for p > 200

qS = 120 + p for p 10

      = 0 for 0 p < 10

Where qD and qS denote the demand for and supply of wheat (in kg) respectively and p denotes the price of wheat per kg in rupees. Since at market equilibrium price clear, we find the equilibrium price (denoted by p*) by equating market demand and supply and solve for p*.

qD(p*) = qS(p*)

200 – p* = 120 + p*

Rearranging terms,

2p* = 80

p* = 40

Therefore, the equilibrium price of wheat is Rs 40 per kg. The equilibrium quantity (denoted by q*) is obtained by substituting the equilibrium price into either the demand or the supply curve’s equation since in equilibrium quantity demanded and supplied are equal.

qD = q* = 200 – 40 = 160

Alternatively,

qS = q* = 120 + 40 = 160

Thus, the equilibrium quantity is 160 kg. At a price less than p*, say p1 = 25

qD = 200 – 25 = 175

qS = 120 + 25 = 145

Therefore, at p1 = 25, qD > qS which implies that there is excess demand at this price.

Algebraically, excess demand (ED) can be expressed as

ED(p) = qD – qS

= 200 – p – (120 + p)

= 80 – 2p

Notice from the above expression that for any price less than p*(= 40), excess demand will be positive.

Similarly, at a price greater than p*, say p2  = 45

qD = 200 – 45 = 155

qS = 120 + 45 = 165

Therefore, there is excess supply at this price since qS > qD. Algebraically, excess supply (ES) can be expressed as

ES(p) = qS – qD

= 120 + p – (200 – p)

= 2p – 80

Notice from the above expression that for any price greater than p*(= 40), excess supply will be positive. Therefore, at any price greater than p*, there will be excess supply, and at any price lower than p*, there will be excess demand.


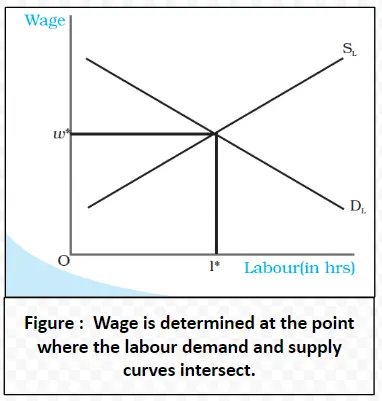
Wage Determination: Balancing Labor Supply and Demand for Market Equilibrium
  • In a perfectly competitive labor market, wage determination follows the principles of supply and demand analysis for Market Equilibrium. Unlike markets for goods, households supply labor, and firms demand it. 
  • The wage rate: It is set where the labor supply and demand curves intersect.
  • Assumptions and Market Conditions: To analyze the demand for labor by a single firm, we assume that
    • The Labor is the only variable input
    • The labor market is perfectly competitive and
    • The firm takes the wage rate as given. 
  • Profit Maximization: The firm operates under profit maximization and adheres to the law of diminishing marginal product.
  • Marginal Revenue Product of Labor (MRPL): When the firm hires labor until the additional cost (wage rate) of hiring one more unit of labor equals the additional benefit is called (MRPL).Thus, while hiring labor, the firm employs labor up to the point where

w = MRPL

and MRPL = MR × MPL

  • MRPL is calculated as the product of marginal revenue (MR) and the marginal product of labor MPL.
  • Wage Rate and  (VMPL): 
    • As long as the Value of Marginal Product of Labor (VMPL) is greater than the wage rate, the firm will hire more labor, increasing profit.
    • Conversely, if VMPL is less than the wage rate, the firm can increase profit by reducing labor.
  • Labour Demand Curve: Due to the law of diminishing marginal product, the firm’s labor demand curve slopes downward.
    • When the wage rate increases, VMPL must also rise, which can only happen if MPL increases.
    • However, because higher wages lead to diminishing returns, the firm employs less labor, resulting in a downward-sloping demand curve.
    • The market demand curve is derived by aggregating individual firm demand curves. Since each firm reduces labor demand as wages rise, the overall market demand curve also slopes downward.
  • Labour Supply Curve: Turning to the supply side, households decide how much labor to provide at a given wage.
    • This involves a trade-off between leisure and income.
    • Single Labour Workforce Scenario: At low wages, people work more when wages rise, but at high wages, they work less. 
    • This leads to a backwards-bending individual labor supply curve.
    • Aggregate Individual Supply: In case of aggregate individual supply curves, we get an upward-sloping market supply curve for labor.
    • Despite some individuals working less at higher wages, many others are attracted to supply more labor.
  • The Equilibrium Wage Rate: It is wage rate where the market supply curve intersects the market demand curve. This point signifies the balance between households’ desired labor supply and firms’ desired hiring, establishing market equilibrium.]

Wage is determined at the point where the labour demand and supply curves intersect.

 Final Result – CIVIL SERVICES EXAMINATION, 2023.   Udaan-Prelims Wallah ( Static ) booklets 2024 released both in english and hindi : Download from Here!     Download UPSC Mains 2023 Question Papers PDF  Free Initiative links -1) Download Prahaar 3.0 for Mains Current Affairs PDF both in English and Hindi 2) Daily Main Answer Writing  , 3) Daily Current Affairs , Editorial Analysis and quiz ,  4) PDF Downloads  UPSC Prelims 2023 Trend Analysis cut-off and answer key

THE MOST
LEARNING PLATFORM

Learn From India's Best Faculty


 Final Result – CIVIL SERVICES EXAMINATION, 2023.   Udaan-Prelims Wallah ( Static ) booklets 2024 released both in english and hindi : Download from Here!     Download UPSC Mains 2023 Question Papers PDF  Free Initiative links -1) Download Prahaar 3.0 for Mains Current Affairs PDF both in English and Hindi 2) Daily Main Answer Writing  , 3) Daily Current Affairs , Editorial Analysis and quiz ,  4) PDF Downloads  UPSC Prelims 2023 Trend Analysis cut-off and answer key

Quick Revise Now !
AVAILABLE FOR DOWNLOAD SOON
UDAAN PRELIMS WALLAH
Comprehensive coverage with a concise format
Integration of PYQ within the booklet
Designed as per recent trends of Prelims questions
हिंदी में भी उपलब्ध
Quick Revise Now !
UDAAN PRELIMS WALLAH
Comprehensive coverage with a concise format
Integration of PYQ within the booklet
Designed as per recent trends of Prelims questions
हिंदी में भी उपलब्ध

<div class="new-fform">


    </div>

    Subscribe our Newsletter
    Sign up now for our exclusive newsletter and be the first to know about our latest Initiatives, Quality Content, and much more.
    *Promise! We won't spam you.
    Yes! I want to Subscribe.