Udaan, Prahaar, Q&A Bank etc.
CA Magazines & Editorials
 December 5, 2023
National income refers to the total value of all goods and services produced within a country’s borders in a specific time frame, typically a year. It’s a key indicator of a country’s economic performance and is used to measure the overall economic activity and standard of living within that nation.
National income can be calculated using various methods, such as the production or value-added method, income method, or expenditure method,
Aggregate income can be measured through three methods: expenditure method, product method, and income method. Refer Figure to understand the GDP by three methods.
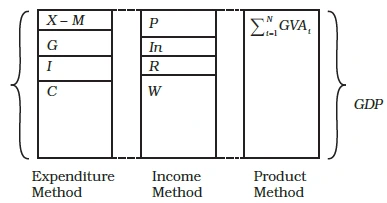
GDP by three Methods
|
The Paradox of Higher Spending
|
|---|
The Impact of Savings: Consistency in Aggregate Income Estimation
Value Added: Assessing a Firm’s Net Contribution in Production
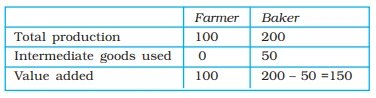
Production, Immediate Goods and Value Added
|
Note –
|
|---|
Income Method: Calculating GDP Through Factor Incomes
Here’s how the national income method is applied:
|
Market Prices Market prices represent the final prices of goods and services that consumers pay. To calculate market prices, one needs to add product taxes (like excise tax, service tax, export and import duties) and subtract product subsidies from basic prices. |
|---|
National Income Measurement in India: Factor Cost, Basic Prices, and Market Prices
| GDP at Factor Cost | This is a measure that focuses on the value of total output produced in the economy, considering only the payment to factors of production (like wages, rent, interest, and profits) and excluding any taxes. In India, GDP at factor cost was widely used as a measure of national income. |
|---|---|
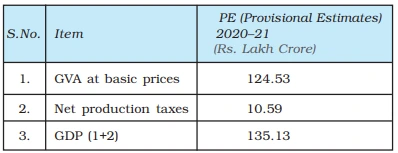
| GVA at Basic Prices | GVA (Gross Value Added) at basic prices is a concept that considers the value of total output produced in the economy minus the value of intermediate consumption (goods used in further production, not for final consumption). It includes net production taxes (production taxes minus production subsidies). |
|
The relationships among these concepts are as follows: GVA at factor cost + Net production taxes = GVA at basic prices GVA at basic prices + Net product taxes = GDP at market prices |
|
GVA and GDP for India at constant (2011-2012) price
Explore SRIJAN Program


Connect with our experts to get free counselling & start preparing
Join India’s trusted platform for expert guidance, quality content, proven success.
Learn anytime, anywhere.


India's leading UPSC coaching platform helping aspirants prepare for IAS, IPS, IFS and other Civil Services examinations with the best faculty and proven strategies.
<div class="new-fform">
</div>