Win up to 100% Scholarship

Register Now

NCERT NOTES

Elevate your UPSC preparation with NCERT Notes – because every word matters on your journey to success.

Consumer Behaviour: Economics of Goods Allocation, Utility, and Preference Analysis

November 29, 2023 689 0

Economics of Consumer Behaviour in Allocating Income to Goods

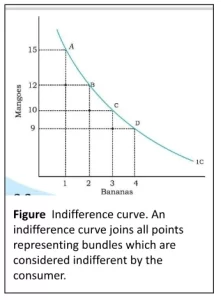
The consumer must choose how to allocate her income among many goods. This is known as the choice problem in consumer behaviour economics. Any buyer will, of course, want to purchase a set of things that will make her feel the happiest.

This depends on the consumer’s tastes (preferences) and what the consumer can afford. Additionally, the pricing of the goods and the consumer’s income determine what the consumer can afford to purchase.
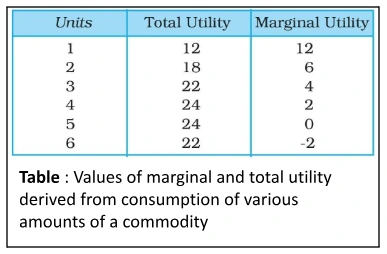
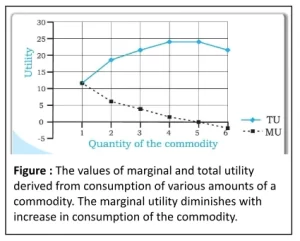
Preliminary Notations and Assumptions: Two-Good Allocation with Bananas and Mangoes in Consumer Behaviour

  • Only Two Goods: We shall consider the consumer’s choice problem in a situation where there are only two goods: bananas and mangoes, reflecting Consumer Behaviour.
  • Two Variables (x1, x2): In general, we shall use the variable x1 to denote the quantity of banana and  x2 to denote the quantity of mangoes. 
    • x1 and x2 can be positive or zero.
  • Example: The bundle (5,10) consists of 5 bananas and 10 mangoes; the bundle (10, 5) consists of 10 bananas and 5 mangoes.

Utility: The Subjectivity and Dynamics of Utility in Changing Preferences and Consumer Behaviour

  • Definition: The utility of a commodity is its want-satisfying capacity. 
    • The more the need for a commodity, the greater the utility derived from the commodity.
  • Utility is subjective: For instance, a person who enjoys chocolate will benefit significantly more from chocolate than a person who does not. 
  • Changing Preferences Over Time and Place: The utility that a given person derives from a given product can alter as time and place change. 
  • Example: The benefit of using a room heater would vary depending on whether the user is in Chennai or Ladakh (location) and if it is summer or winter (season).

Cardinal Utility Analysis: Cardinal Utility Analysis and the Law of Diminishing Marginal Utility

Cardinal Utility Analysis

Measures of Utility: Total and Marginal Satisfaction in Consumption

  • The total utility: It is of a fixed quantity of a commodity (TU) is the total satisfaction derived from consuming the given amount of some commodity x. 
    • TUn refers to total utility derived from consuming n units of a commodity x.
  • Marginal utility (MU): It is the change in total utility due to the consumption of one additional unit of a commodity.

MUn = TUn – TUn-1

  • Total utility and marginal utility can also be related in the following way. 

TUn = MU1 + MU2 + … + MUn-1 + MUn

  • Table and Figure show an imaginary example of the values of marginal and total utility derived from the consumption of various amounts of a commodity.
  • The Measure of Marginal Utility: The rate of change in total utility due to a change in the quantity of commodity consumed is a measure of marginal utility. 
    • MU becomes zero at a level when TU remains constant. 
    • In the example, TU does not change at the 5th unit of consumption and therefore MU5 = 0. Thereafter, TU starts falling and MU becomes negative.
  • The Law of Diminishing Marginal Utility: It states that marginal utility from consuming each additional unit of a commodity declines as its consumption increases while keeping the consumption of other commodities constant.

Quantity of the Commiodity

Derivation of Demand Curve in the Case of a Single Commodity ( Law of Diminishing Marginal Utility): Factors and Law in Single-Commodity Markets

  • Factors that Influences Demand in Consumer Behaviour: In addition to the price of the commodity itself, demand for a commodity x is influenced by other prices for commodities, consumer income, and Consumer Behaviour and tastes. 
  • A Demand Curve: It is a visual representation of the varied quantities of a good that a Consumer Behaviour is willing to purchase at varying prices of the same good while maintaining constant prices of other goods that are similar to it.
  • Figure  represents a hypothetical demand curve of an individual for commodity x at its different prices.
    • An explanation for a downward-sloping demand curve rests on the notion of diminishing marginal utility. 
  • Law of Demand: There is a negative relationship between the price of a commodity and the quantity demanded which is referred to as the Law of Demand.

Derivation of Demand Curve in the Case of a Single Commodity

Ordinal Utility Analysis: Indifference Curves and Marginal Rate of Substitution

  • Consumption Bundles: In the realm of consumer behaviour, The consumer does not measure utility in numbers, though she often ranks various consumption bundles. 
    • The points representing bundles which give the consumer equal utility can generally be joined to obtain a curve like the one in Figure. 
  • Equal Utility Across Bundles: The consumer is said to be indifferent to the different bundles because each point of the bundles gives the consumer equal utility.  
  • Indifference Curve: Such a curve joining all points representing bundles among which the consumer is indifferent is called an indifference curve.
  • Equal Satisfaction Along Curve: All the points such as A, B, C and D lying on an indifference curve provide the consumer with the same level of satisfaction.
  • Marginal rate of Substitution: The amount of mangoes that the consumer has to forego, in order to get an additional banana, her total utility level being the same, is called the marginal rate of substitution (MRS). 
    • MRS is simply the rate at which the consumer will substitute bananas for mangoes so that her total utility remains constant. So,  MRS =|∆Y/∆X|3   
    • MRS diminishes with an increase in the number of bananas.
  • Law of Diminishing Marginal Rate of Substitution:  It states that the tendency for the MRS to fall with an increase in the quantity of bananas.
    • Consumers sacrifice smaller and smaller quantities of mangoes for each additional banana.

Ordinal Utility Analysis

Shape of an Indifference Curve: Convexity and Perfect Substitutes in Consumer Behaviour

  • The Convex Shape of Indifference Curves: The law of Diminishing Marginal Rate of Substitution causes an indifference curve to be convex to the origin.
  • Perfect Substitutes: But in case of goods being perfect substitutes, the marginal rate of substitution does not diminish.
    • For instance, consider that within the realm of consumer behaviour, consumers have a set of 5 rupee coins and 5 rupee notes.
    • As long as the sum of the five rupee coins and five rupee notes stays the same, the consumer is unconcerned with any of these combinations. 
    • It barely matters to the consumer whether she receives a five rupee coin or a five rupee note. 
  • Straight-Line for Perfect Substitutes: The indifference curve that represents these two commodities as ideal alternatives for the consumer will be a straight line.
    • In consumer behaviour figures , it can be seen that the consumer sacrifices the same number of five-rupee coins each time he has an additional five-rupee note.

Representation of Law of Diminishing Marginal Rate of Substitution

Monotonic Preferences: Monotonic Preferences for Bundles with More Goods

  • Consumer Behaviour preferences are monotonic preferences, where a consumer prefers a bundle with more of one good than another, based on the presence of at least one good in both bundles. 
  • This preference is based on the bundle having more goods than the other.

Figure Indifference Curve for perfect substitutes. Indifference curve depicting two commodities which are perfect substitutes is a straight line.

Indifference Map: Preferences for Preferred Bundles

  • It represents consumer behaviour preferences over bundles, with points on it representing indifferent bundles. 
  • Monotonicity of preferences means bundles on the above curve are preferred. 

Indifference Map. A family of indifference curves. The arrow indicates that bundles on higher indifference curves are preferred by the consumer to the bundles on lower indifference curves.

Features of Indifference Curve: Utility, Preferences, and Non-Intersecting Paths

  • Indifference Curve Slopes Downwards from Left to Right: Downsloping Indifference Curve Dynamics
    • An indifference curve within the context of Consumer Behaviour slopes downwards, meaning a consumer needs to forgo some mangoes to have more bananas. 
    • If the consumer doesn’t forego mangoes, they’ll have more bananas with the same number, causing a higher indifference curve.
  • A Higher Indifference Curve Gives a Greater Level of Utility: Higher Indifference Curve, More Satisfaction
    • As long as the marginal utility of a commodity is positive, an individual will always prefer more of that commodity, as more of the commodity will increase the level of satisfaction.

Representation of different level of utilities from different combination of goods

  • Table  and Figure  show three banana and mango combinations: Satisfaction and Indifference Curve
    • A, B, and C. B has more bananas, indicating higher satisfaction, while C has more bananas, indicating higher satisfaction and a higher indifference curve. 
    • Both combinations have equal mango quantities.
    • Combinations that provide a higher level of enjoyment will have a higher indifference curve made up of combinations with more mangoes, bananas, or both.
  • Two Indifference Curves Never Intersect Each Other: Avoiding Conflicting Satisfaction Levels
    • Two indifference curves intersecting each other within the domain of consumer behaviour can result in conflicting results. 
    • Example: Points A and B on the same indifference curve IC1 and points A and C on the same curve IC2 will yield the same level of satisfaction.
    • The utility from point B and point C is not equal, as the consumer benefits more at point B than at point C, indicating that intersecting indifference curves will produce conflicting results.

higher indifference curve

 Final Result – CIVIL SERVICES EXAMINATION, 2023.   Udaan-Prelims Wallah ( Static ) booklets 2024 released both in english and hindi : Download from Here!     Download UPSC Mains 2023 Question Papers PDF  Free Initiative links -1) Download Prahaar 3.0 for Mains Current Affairs PDF both in English and Hindi 2) Daily Main Answer Writing  , 3) Daily Current Affairs , Editorial Analysis and quiz ,  4) PDF Downloads  UPSC Prelims 2023 Trend Analysis cut-off and answer key

THE MOST
LEARNING PLATFORM

Learn From India's Best Faculty


 Final Result – CIVIL SERVICES EXAMINATION, 2023.   Udaan-Prelims Wallah ( Static ) booklets 2024 released both in english and hindi : Download from Here!     Download UPSC Mains 2023 Question Papers PDF  Free Initiative links -1) Download Prahaar 3.0 for Mains Current Affairs PDF both in English and Hindi 2) Daily Main Answer Writing  , 3) Daily Current Affairs , Editorial Analysis and quiz ,  4) PDF Downloads  UPSC Prelims 2023 Trend Analysis cut-off and answer key

Quick Revise Now !
AVAILABLE FOR DOWNLOAD SOON
UDAAN PRELIMS WALLAH
Comprehensive coverage with a concise format
Integration of PYQ within the booklet
Designed as per recent trends of Prelims questions
हिंदी में भी उपलब्ध
Quick Revise Now !
UDAAN PRELIMS WALLAH
Comprehensive coverage with a concise format
Integration of PYQ within the booklet
Designed as per recent trends of Prelims questions
हिंदी में भी उपलब्ध

<div class="new-fform">


    </div>

    Subscribe our Newsletter
    Sign up now for our exclusive newsletter and be the first to know about our latest Initiatives, Quality Content, and much more.
    *Promise! We won't spam you.
    Yes! I want to Subscribe.