Recently, the Household Consumption Expenditure Survey was conducted for the second consecutive year (2023-24) after a 11-year gap since 2011-12, following the cancellation of 2017-18 survey data due to “quality” concerns.
- Two consecutive surveys were conducted for the periods August 2022–July 2023 and August 2023–July 2024, following the normalization of the COVID-19 pandemic situation.
- The survey data is used to update the basket and weights for calculating the Consumer Price Index (CPI), measure poverty, inequality, and social exclusion, and analyze economic conditions.
- The Monthly Per Capita Consumption Expenditure (MPCE) serves as the primary indicator for analytical purposes.
Enroll now for UPSC Online Course
Imputed Values
- Imputed for goods received via welfare programs (e.g., rice, wheat, school uniforms, footwear).
- Health and education services excluded due to valuation complexity.
|
Key Findings
- Monthly Per Capita Consumption Expenditure Estimates:
- Rural: ₹4,122 (without imputation), ₹4,247 (with imputation).
- Urban: ₹6,996 (without imputation), ₹7,078 (with imputation).
- MPCE increased by 9% in rural areas and 8% in urban areas compared to 2022-23.
- Urban-Rural Gap:
- The gap narrowed to 70% in 2023-24 from 71% in 2022-23 and 84% in 2011-12, indicating rural consumption growth.
- Consumption Inequality:
- Gini Coefficient declined:
- Rural: 0.237 (2023-24) from 0.266 (2022-23).
- Urban: 0.284 (2023-24) from 0.314 (2022-23).
- Maximum MPCE growth (22% rural, 19% urban) observed among the bottom 5%–10% population.
- Spending Composition:
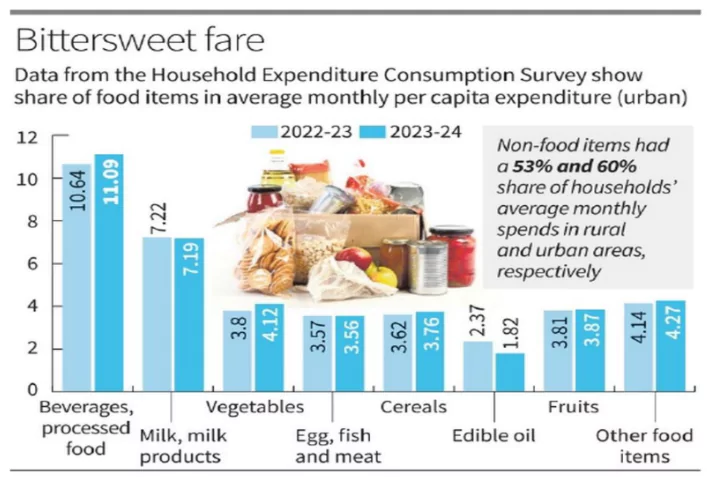
- Non-food items dominate: 53% in rural and 60% in urban MPCE.
- Food and beverage spending was reduced due to lower spending on edible oils, despite high food inflation.
- Vegetable spending increased.
- Major non-food contributors: conveyance, clothing, durable goods, rent.
State and Union Territory-wise MPCE
- Highest MPCE:
- States: Sikkim (Rural: ₹9,377, Urban: ₹13,927).
- UTs: Chandigarh (Rural: ₹8,857, Urban: ₹13,425).
- Lowest MPCE:
- States: Chhattisgarh (Rural: ₹2,739, Urban: ₹4,927).
- UTs: Dadra & Nagar Haveli and Daman & Diu (Rural: ₹4,311) and Jammu & Kashmir (Urban: ₹6,327).
- Regional Disparities:
- Highest rural-urban MPCE gap in Meghalaya (104%), followed by Jharkhand (83%) and Chhattisgarh (80%).
- Nine out of eighteen major states have MPCE above the national average.
Check Out UPSC CSE Books From PW Store
Comparison with 2011-12
| Year |
Rural MPCE (₹) |
Urban MPCE (₹) |
Adjusted for 2011-12 Prices (Rural ₹) |
Adjusted for 2011-12 Prices (Urban ₹) |
| 2011-12 |
1,430 |
2,630 |
1,430 |
2,630 |
| 2023-24 |
4,122 |
6,996 |
2,079 |
3,632 |

About Household Consumption Expenditure Survey (HCES)
- Conducting Authority: The survey is conducted by the National Statistical Office (NSO) every 3–5 years.
- Initially, HCES was conducted annually starting in 1950-51. However, since its 26th round, it has been conducted approximately every five years.
- Purpose of the Survey: The survey is designed to collect information on the consumption of goods and services by households.
- Coverage: The survey covers the entire Indian Union, excluding a few inaccessible villages in the Andaman and Nicobar Islands.
- Significance of the Collected Data
- It helps in assessing trends in economic well-being.
- It is used to estimate poverty levels.
- It updates weightages in the Consumer Price Index (CPI) to measure retail inflation.
Enroll now for UPSC Online Classes
About National Statistical Office (NSO)
- Formation: NSO was formed in 2019 by merging the Central Statistical Office (CSO) and the National Sample Survey Office (NSSO).
- Recommendation: The establishment of NSO as the nodal body for core statistical activities was first suggested by the C. Rangarajan Committee.
- Affiliation: NSO operates under the Ministry of Statistics and Programme Implementation (MoSPI).
- Function: It collects, compiles, and disseminates reliable, objective, and relevant statistical data.
![]() 28 Dec 2024
28 Dec 2024

