Context:

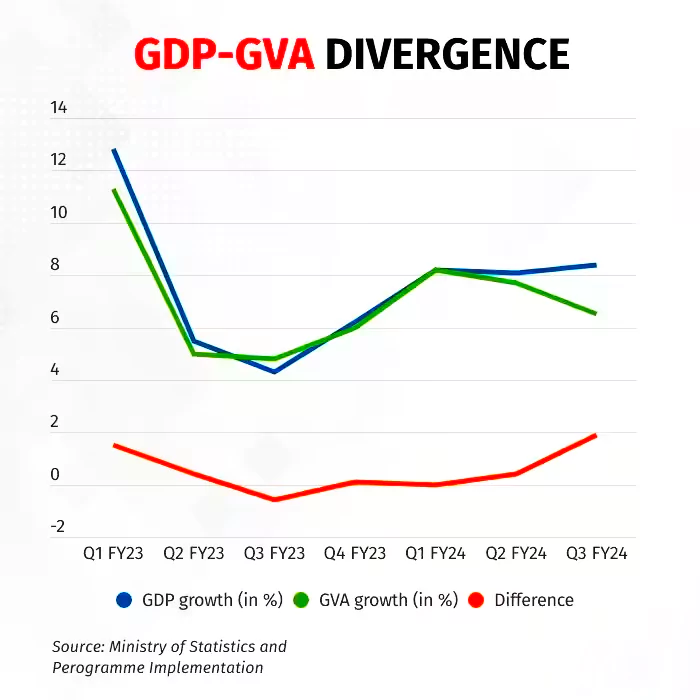
Recently, Data released by the National Statistical Office (NSO) showed that the difference between the two sets of growth rates widened to a 10 Year high in Q3 (Oct-Dec 2023-24).
Q3FY24: Indian GDP Surges to 8.4% While GVA Growth Moderates at 6.5%
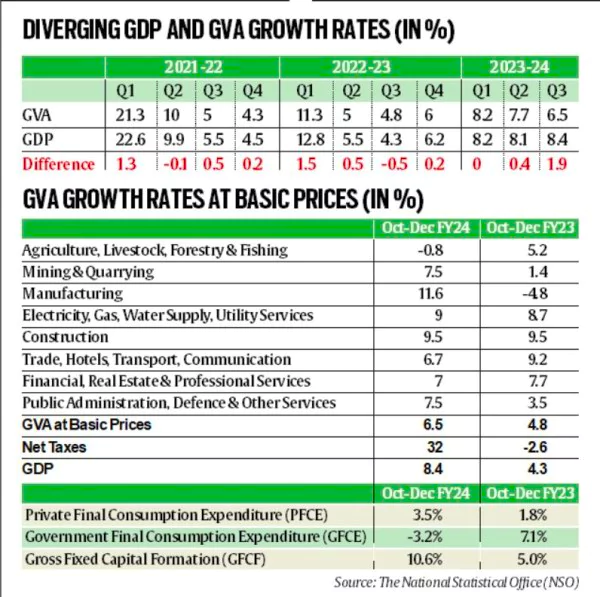
- Indian GDP vs GVA Growth Rates: Data showed that During Q3FY24, India witnessed a surge in GDP growth to 8.4%, surpassing expectations, while GVA growth moderated to 6.5%.
- Divergence is Due to A sharp increase in net taxes & fall in subsidies, underscores the complexity of economic interpretation.
- The difference between the two growth rates widened to 190 basis points in Q3 from 40 basis Points in the previous charter.
Reasons Behind Indian GDP Surge in Q3FY24?

-
Due to Variation in Sectoral Contribution:
- Key sectors such as Manufacturing and Construction exhibited robust growth rates of 11.6% and 9.5%, supported by Public capital expenditure.
-
Due to growth in Tax Collection:
-
- Luxury goods and services, unlike essentials, contribute significantly to tax revenue, highlighting the influence of taxation policies on economic indicators.
- However, with Subdued private consumption at 3.5% in Q3, and a Decline in government spending by 3.2% in Q3, from a 13.8% growth in Q2 & the agriculture sector witnessed a contraction of 0.8% in GVA growth in Q3, down from 1.6% in Q2. complicate the overall economic picture.
What Is GDP?
- GDP represents the total value of goods and services produced within a country’s borders over a specified period, offering a comprehensive overview of the country’s economic health.
- Components of GDP: It encompasses private and public consumption, government expenditures, investments, additions to private inventories, paid-in construction costs, and the foreign balance of trade.
- Calculation of GDP: GDP = private consumption + gross investment + government investment + government spending + (exports-imports)
What Is GVA in Economics?
- GVA measures the value of goods and services produced in a specific area, considering the value added to a product. In India, GVA is measured at ‘basic prices’.
- Calculation of GVA: It is calculated by deducting the intermediate value of consumption from the total output produced, reflecting the added value generated during the production process.
GDP Vs GVA
- GDP being derived from GVA and adjusted for taxes levied by governments on products and subsidies provided by the government.
- GDP = GVA + Taxes on products – Subsidies on products.
- GDP is >> GVA, due to the higher amount of taxes received compared to subsidies provided by the government.
Conclusion
During Q3 of FY24 in India, the deviation in GDP and GVA shows how economic recovery is complicated. Although overall GDP looks strong, looking at GVA and specific sectors gives a more detailed picture. Dependence on public spending highlights the need for balanced and sustainable growth for India’s economy.
Also Read: Agriculture Export Policy Of India
News Source: The Indian Express
![]() 2 Mar 2024
2 Mar 2024

