Context
This Article is based on the news “’Our estimates & those on Tendulkar formula show poverty fall over 12 yrs’ which was published in the Business Standard. Economists C Rangarajan and S Mahendra Dev have released the poverty estimates in India based on the latest Household Consumption Expenditure Survey(HCES) by updating poverty lines recommended by the Rangarajan committee.
Household Consumption Expenditure Survey (HCES)
- Household Consumption Expenditure Survey (HCES) is designed to collect information on the consumption of goods and services by households.
- Information collected in HCES is useful for understanding the consumption and expenditure pattern, standard of living and well-being of the households.
Gini coefficient, or the Gini index:
- Gini coefficient, or the Gini index measures the inequality of income distribution, whereas a higher value closer to one (or 100 percent) represents greater inequality.
|
New Poverty Estimates: SBI Research vs. Brookings Institution
- Poverty Estimates based on HCES Survey: SBI Research and economists of the US think tank Brookings Institution, Surjit Bhalla and Karan Bhasin have also released their poverty estimates recently based on the latest HCES survey, using different parameters.
- The HCES report has been released after 11 years.
- Controversy Over Poverty Estimates: This has sparked a debate about the methodologies adopted for poverty estimation in India.
Key Findings of Poverty Estimates by C Rangarajan and S Mahendra Dev
-
Poverty Line:
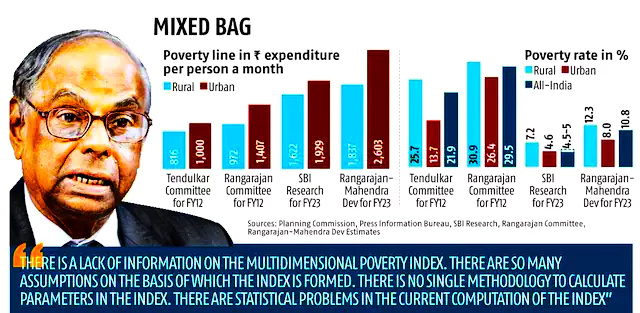
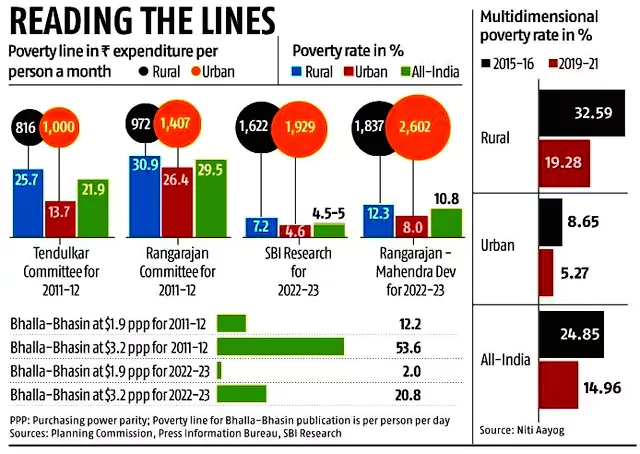
- According to them, the poverty line is Rs 1,837 for rural and Rs 2,603 for urban areas in 2022-23.
- The poverty line for 2011-12 was Rs 972 and Rs 1,407 per capita per month respectively for rural and urban areas.
-
More Significant Poverty Decline in Urban Areas:
- The rate of poverty decline in percentage point terms in the last decade was higher in urban areas than in rural areas.
Other Recent Poverty Estimates in India
-
SBI Research:
- Poverty Line: As per the SBI report, the poverty line has been estimated at Rs 1,622 in rural areas and Rs 1,929 in urban areas.
- Decline in Poverty: Rural poverty declined to 7.2 percent in 2022-23 from 25.7 percent in 2011-12, while urban poverty reduced to 4.6 percent from 13.7 percent during the same period.
-
Economists of US think tank Brookings Institution:
-
- Decline in Urban and Rural Inequality: There has been a decline in urban and rural inequality. The urban Gini declined from 36.7 to 31.9 and the rural Gini declined from 28.7 to 27.0.
- Rural poverty stood at 2.5 percent, while urban poverty was down to 1 percent.
- Increase in Per Capita Consumption: Real per capita consumption has grown 2.9 percent per annum since 2011-12, with rural growth at 3.1 percent being significantly higher than urban growth of 2.6 per cent.
- Decline in HCR: Headcount Poverty Ratio (HCR), the proportion of a population that lives below the poverty line, has declined from 12.2 per cent in 2011-12 to 2 per cent in 2022-23, equivalent to 0.93 percentage points per year.
|
Poverty Estimation in India
-
Poverty:
- According to the World Bank, poverty is pronounced deprivation in well-being and comprises many dimensions.
- It includes low incomes and the inability to acquire the essential goods and services necessary for survival with dignity.
- The international poverty line is currently $2.15 per person per day.
-
Poverty Line:
- The poverty in India is measured based on the poverty line quantified in terms of per capita consumption expenditure.
-
Calculation of the Poverty Line:
- In India, Measures of poverty are calculated by considering the minimum requirements for food, clothing, footwear, fuel, light, education, medical care, and more.
- These requirements are measured in physical quantities and multiplied by their rupee prices.
-
Calculation Based on Calorie Intake and Demographic Factors:
- The formula for determining the food requirement is based on the desired calorie intake, with different calorie needs for various age groups, sexes, and types of work.
- In rural areas, the accepted average calorie requirement in India is 2400 calories per person per day, while in urban areas, it is 2100 calories per day.
-
Periodic Revisions of Monetary Expenditure:
- The monetary expenditure needed to meet these calorie requirements through food grains and other items is revised periodically to account for rising prices.
- Example: In 2011-12, the poverty line was set at Rs 816 per month for rural areas and Rs 1000 per month for urban areas. The higher amount for urban areas reflects the generally higher prices of essential products in cities.
Different Methodologies Used for Poverty Estimation
-
Methodology Adopted by Rangarajan and Mahendra Dev During Recent Poverty Estimates:
- Rangarajan Panel Line: They recalculated poverty figures using the latest HCES updating the poverty lines recommended by Rangarajan’s committee.
- They used the Rangarajan panel line for 2011-12 and adjusted it for 2022-23.
-
Methodology Adopted by SBI:
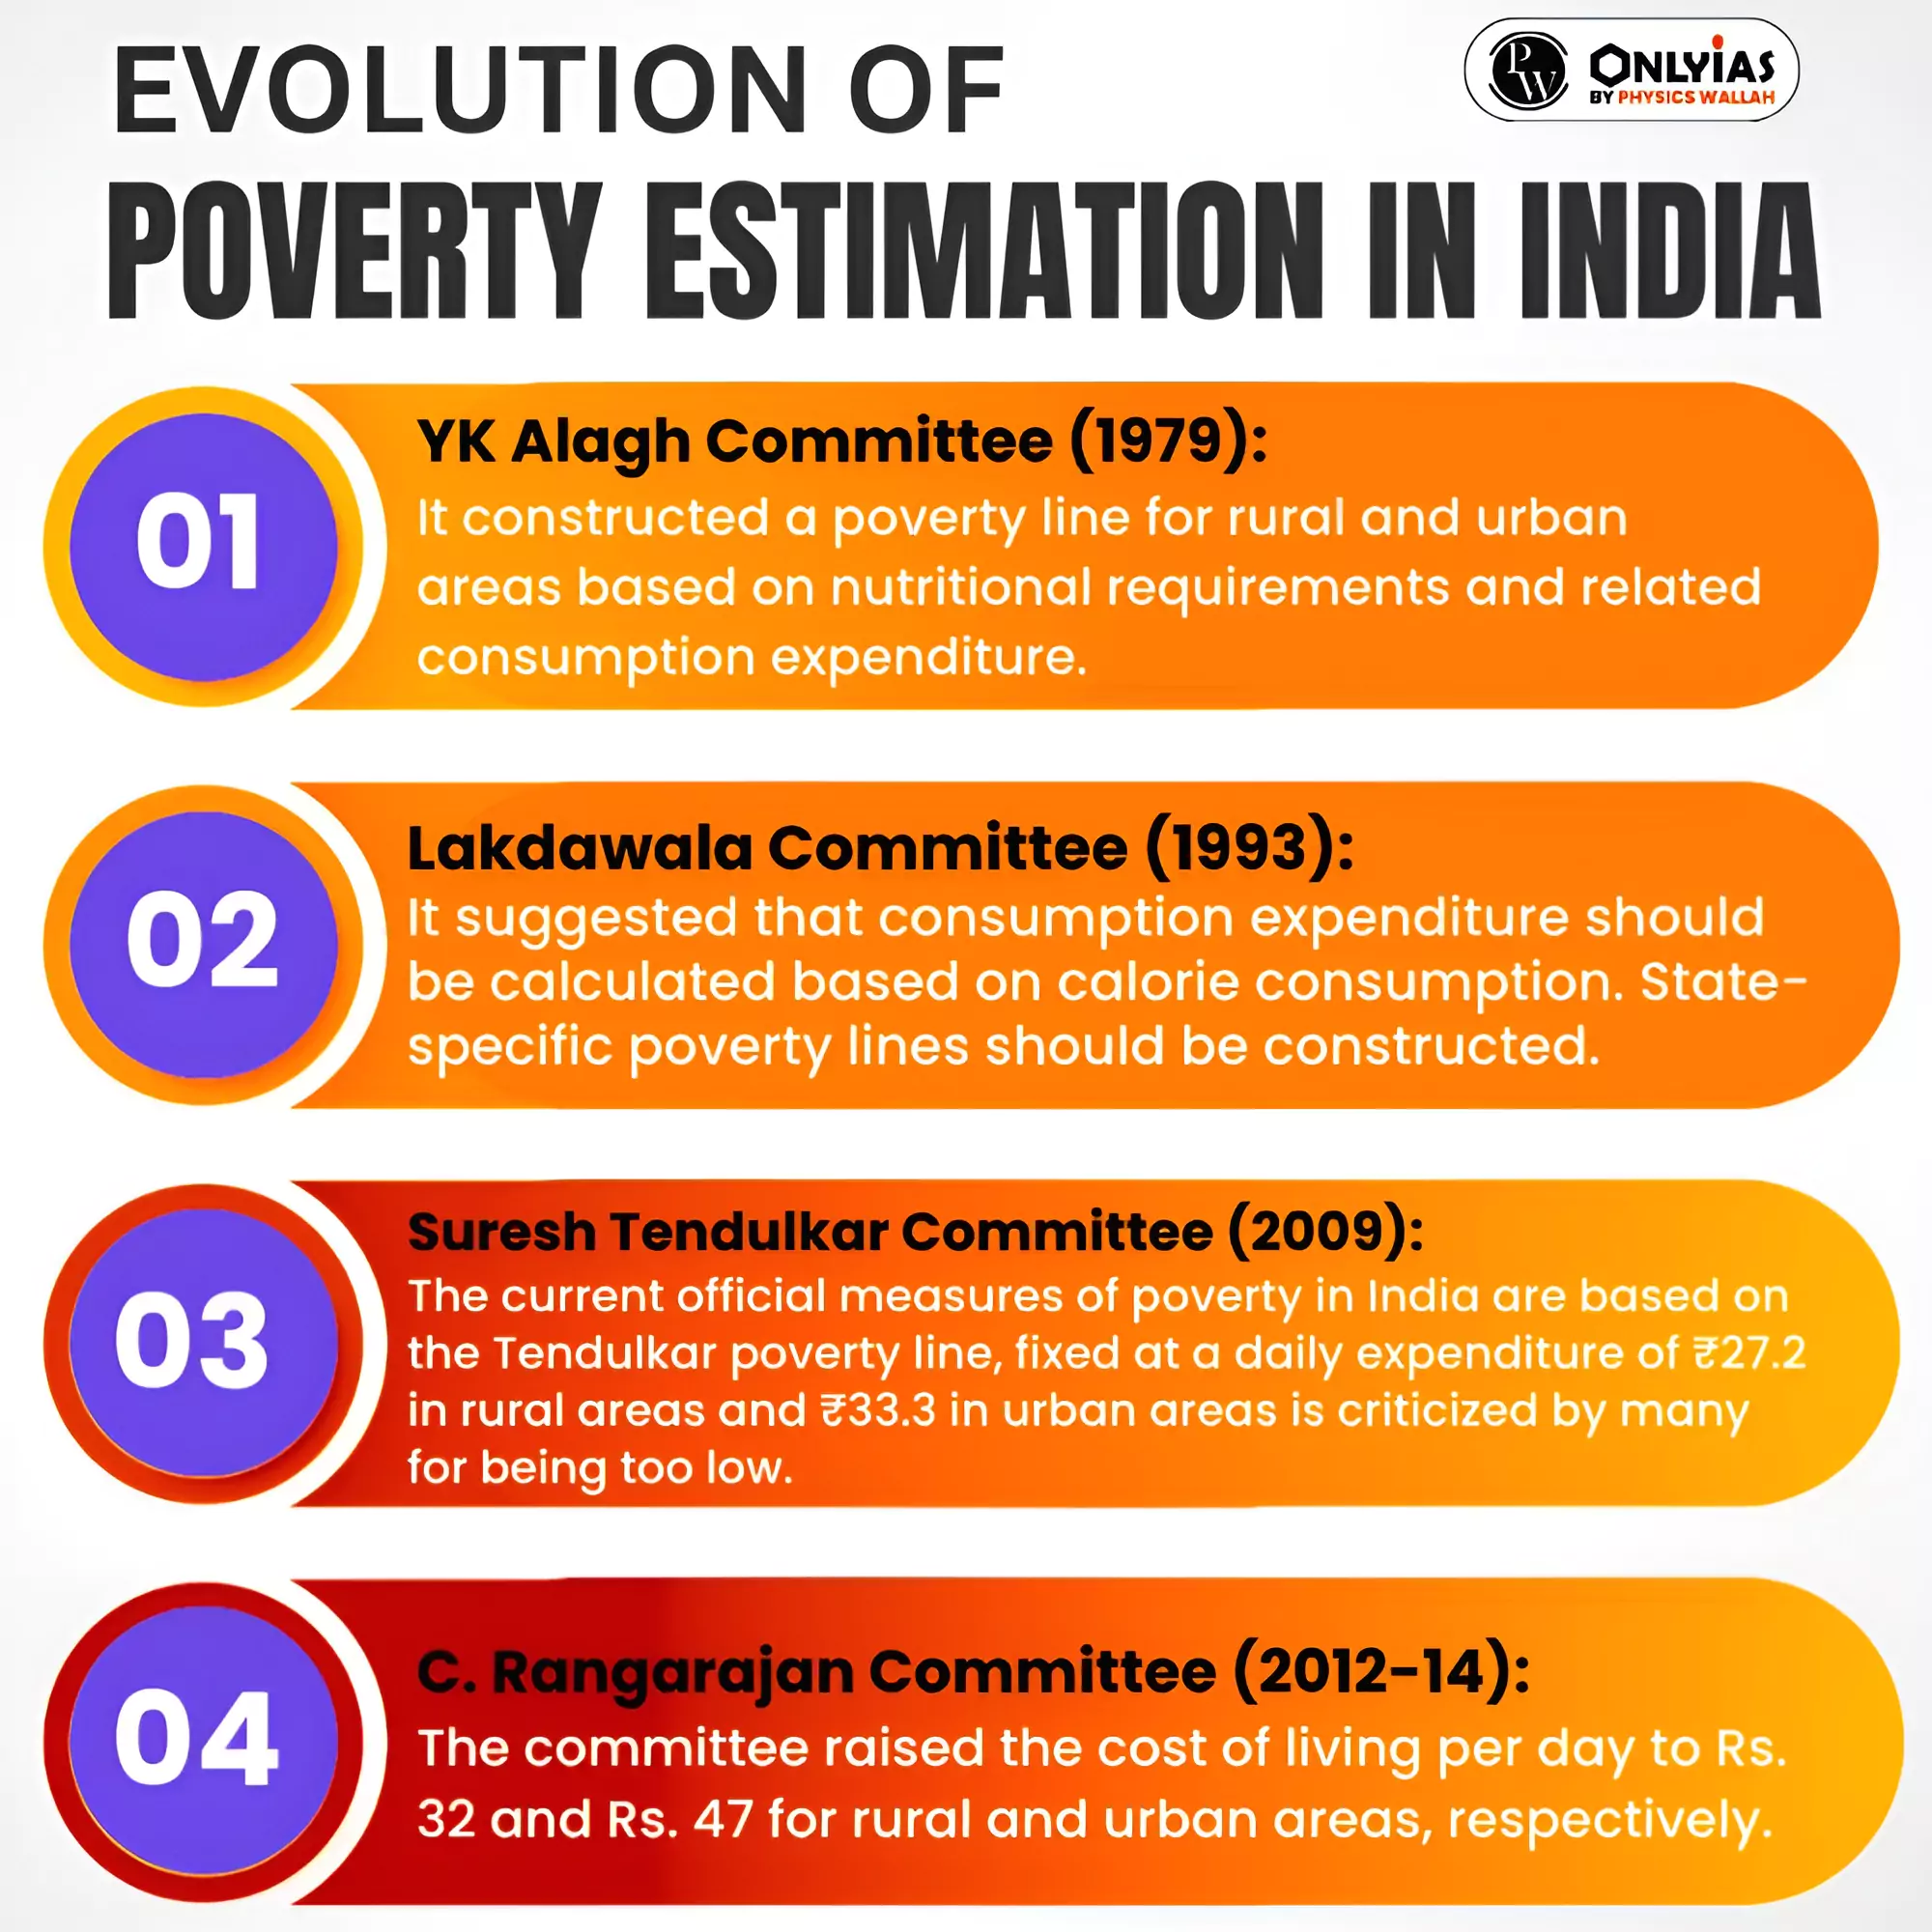
- Based on the Suresh Tendulkar Committee, SBI Research took the Suresh Tendulkar Committee recommendations for 2011-12 as the base.
- Inflation Adjusted data: It revised poverty line estimates by incorporating inflation data from the past decade onto the poverty line established by the Tendulkar committee for 2011-12.
- Adjustment of Food Items: Free food items, among other goods and services provided by government schemes, were also accounted for.
-
Methodology Adopted by Economists Bhalla and Bhasin:
- World Bank Poverty Line: They used the World Bank lines to estimate the poverty rate based on the survey.
- Exclusion of Government Aid: These estimates did not consider the free foodgrains supplied by the government to two-thirds of the population and the utilisation of public health and education.
Issues with Current Poverty Estimation/ Need for New Poverty Lines
-
Lack of Declared Income Poverty Line:
- The government has not announced any clear poverty line in India due to which the Tendulkar line and the World Bank’s purchasing power poverty line of $2.15 a day have been used for current poverty estimates.
- This gives less than 5% extreme poverty or extreme deprivation.
- The Tendulkar line itself was based on specific minimum calorie requirements to be fulfilled and therefore households that spend at least that much on calories would be above the line.
-
Application of Old Poverty Line to Current Estimates:
- The ‘Tendulkar poverty line’ has been used to assess poverty in 2022-23 based on the latest HCES data.
- The two datasets are not directly comparable due to changes in data collection methods in the latest HCES survey.
- The latest survey is based on three visits, which included multiple visits compared to single visits during earlier surveys.
- The HCES data hasn’t been fully released yet. Therefore, applying the old poverty line to this dataset is inappropriate until the available unit-level data.
-
Inconsistency in Data Collection Method:
- The changes in data collection methods of HCES, including multiple visits, raise concerns about the consistency of responses provided during these visits.”
- The non-permanent status of enumerators employed is also a challenge.
-
Changes in Sampling Methodology:
- In the HCES 2022-23, there has been a notable alteration in the sampling methodology. For instance, the second stage stratum classification now relies on land ownership for rural areas and car ownership for urban areas.
- This is a departure from the previous survey where divisions were based on household status and activity for rural areas and monthly per-capita income for urban areas.
- This disproportionately represents affluent sections of society, resulting in higher consumption expenditure.
- Discrepancy in Consumption Estimates: There is a discrepancy between the National Accounts Statistics (NAS) statistic and the total private consumption expenditure provided by the NSSO.
- From a difference of less than 10 per cent in the late 1970s, it has come to 53 per cent in 2011-12. This difference declined only marginally to 52 per cent in 2022-23.
- Skepticism About Real Poverty Reduction: The significant increase in workers earning up to Rs 100 per day in real terms at 2010 prices, from 106.1 million in 2011-12 to nearly 190 million in 2021-22, raises doubts about poverty reduction claims.
- Inadequateness of Calorie Norms: According to the former chief statistician, the basic calorie norm is inadequate because it only looks at the consumption of cereals.
- Moreover, the composition of food production has changed enormously.
- These estimates do not consider the free food (wheat and rice) supplied by the government to approximately two-thirds of the population, nor utilisation of public health and education.
Sources of Consumption Expenditure in India
- There are two sources of consumption expenditure data in India: the NSO surveys and National Accounts Statistics (NAS).
- NSO Survey: As a part of the NAS, the Central Statistical Organisation (CSO) compiles annually the estimates of private consumption.
- It is available as a macro estimate and a scalar for the nation.
- NAS: The HCES of the NSO yields the estimates of private consumption. These are available separately for different states (provinces) in rural and urban areas, which can be aggregated into a national estimate.
- The estimates of private consumption from these two sources are different, primarily as these are derived from different approaches.
|
Way Forward to Poverty Estimation in India:
-
Uniform Poverty Line:
- A uniform poverty line is needed in India as it will provide a standardized measure to assess poverty levels across different regions of India.
- It will facilitate more accurate comparisons and assessments of poverty levels both within and across states.
- It will also help in international comparisons of poverty rates and trends, enabling India to compare its progress against other countries.
-
Reducing Differences Between NSO and NAS:
- The NSO Advisory Group must study the problem and come out with possible suggestions for improving the collection of data through both routes.
-
Updation of Poverty Norms:
- The exercise undertaken by SBI based on the Tendulkar committee report revised the poverty line estimates by applying inflation rates from the past decade to the poverty line for 2011-12.
- However, over the years, the poverty norms need updating, and work should be done to evolve the understanding and definitions of poverty.
-
Recalibration of Poverty Lines:
- Poverty lines have to be recalibrated depending on changes in income, consumption patterns and prices.
-
Coordination Among Survey Authorities:
-
- It is imperative to align their findings with those of the National Accounts, necessitating collaborative efforts to reconcile discrepancies.
-
Examining Labour Market Dynamics:
- With approximately 144 million workers falling into the income bracket of Rs 100 to Rs 200 in 2021-22, it becomes imperative to scrutinize labor market conditions to ascertain the true extent of poverty alleviation efforts.
Also Read: Supreme Court Verdict On Chandigarh Mayor Elections
| Prelims PYQ (2018):
With reference to the provisions made under the National Food Security Act, 2013, consider the following statements:
1. The families coming under the category of ‘below poverty line (BPL)’ only are eligible to receive subsidies food grains.
2. The eldest woman in a household, of age 18 years or above, shall be the head of the household for the purpose of issuance of a ration card.
3. Pregnant women and lactating mothers are entitled to a ‘take-home ration’ of 1600 calories per day during pregnancy and for six months thereafter.
Which of the statements given above is/are correct?
(a) 1 and 2
(b) 2 only
(c) 1 and 3
(d) 3 only
Ans: (b) |
 15 Mar 2024