Context:
Multidimensional poverty estimates are not substitutes for National Sample Survey (NSS) consumption-based poverty ratios.
About Poverty:
- Poverty is a state or condition in which a person or community lacks the financial resources and essentials to enjoy a minimum standard of life and well-being that is considered acceptable in society.
- Absolutely poverty: It refers to a condition where a person does not have the minimum amount of income needed to meet the minimum requirements for one or more basic living needs over an extended period of time. It may be calculated in monetary terms, nutrition attainment or calories terms.
- Relative poverty: It occurs when people do not enjoy a certain minimum level of living standards as determined by the government (and enjoyed by the bulk of the population) that varies from country to country, which is said to be increasing and may possibly never be eradicated.
History of Calculation of Poverty in India:
- Dada Bhai Naoroji (1867-68): He concluded the base line in 1867-68 price which was based on the cost of a subsistence diet consisting of ‘rice or flour, daal, mutton, vegetables, ghee, vegetable oil and salt’.
- National Planning Committee (NPC), 1938: Congress President Subhash Chandra Bose set up the NPC with Jawaharlal Nehru as the Chairman. The Committee regarded the irreducible minimum income between Rs. 15 and Rs. 25 per capita per month at pre-war prices.
- Working Group of the Planning Commission (1962): It finalised that each household of five persons should be not less than Rs. 100 per month for rural and Rs. 125 for urban at 1960-61 prices.
- Y. K. Alagh Committee (1979): It was decided that poverty should be measured precisely based on starvation. Y. K. Alagh Committee was constituted which gave its recommendation as the people consuming less than 2,100 calories in the urban areas or less than 2,400 calories in the rural areas are poor.
- Lakdawala Committee 1993: Recommended poverty line approach to be continued on basis of calorie consumption on fixed consumption basket.
- Suresh Tendulkar Committee 2005:
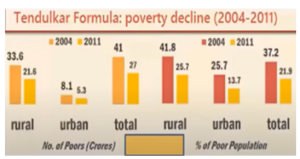 This committee recommended to shift away from the calorie-based model and made the poverty line somewhat broad based by considering monthly spending on education, health, electricity and transport.
- It supported nutritional intake rather than caloric intake. The committee also drew a line based on cost of living. The Tendulkar panel stipulated a benchmark daily per capita expenditure of Rs. 27 and Rs. 33 in rural and urban areas, respectively.
- Rangarajan Committee 2012: It recommended that poverty line be based on normative and behavioural level while also accounting for the nutritional requirements.
Consumption-based poverty estimates have relevance:
- According to NITI Aayog report on multidimensional poverty
- The percentage of the poor has gone down from 25% in 2015-16 to 15% in 2019-21.
 Around 135 million people were lifted out of poverty during this period.
- According to the Global Multidimensional Poverty Index report of 2023 of the United Nations Development Programme (UNDP) and the Oxford Poverty & Human Development Initiative (OPHI), the incidence of the multidimensional poverty index declined from 27.5% in 2015-16 to 16.2% in 2019-21.
- The estimates of poverty based on consumer expenditure and using the Tendulkar committee methodology show (over a seven-year period between 2004-05 and 2011-12) that the number of poor came down by 137 million despite an increase in population.
- According to the Rangarajan Committee methodology, the decline between 2009-10 and 2011-12 is 92 million, which is 46 million per annum. For a decade, it will be larger than that of global MPI.
- However, in absolute terms, the poverty ratios based on the Tendulkar and Rangarajan Committee methodologies are lower than as estimated by global MPI.
Challenges Associated with the MPI:
- Measurability Challenges: If an MPI is being used to measure education, one indicator might be the average years of schooling completed. However, this doesn’t capture the quality of education. Two people might both have completed six years of schooling, but one might have received a high-quality education while the other didn’t.
- Aggregation Issues: Imagine combining indicators like access to clean water, nutrition, and housing quality into an MPI. It’s like trying to create a single grade for a student who got different scores in math, science, and history. How do you decide which indicator is more important and should carry more weight?
- Data Availability and Frequency: Let’s say you’re calculating an MPI for a rural area. You have data on income and housing quality, but the data on healthcare services is not updated from three years. This can lead to an inaccurate picture of people’s well-being because their current health situation might be different.
- Interpretation Difficulties: If a country’s MPI improves from 0.25 to 0.20, it’s not immediately clear how much better off people are. It is difficult to translate these MPI scores into real-life changes that people can understand.
- Complexity: Explaining the MPI to someone who isn’t an expert can be challenging. It’s like trying to explain a complex recipe to someone who doesn’t cook often.
Conclusion
Thus, consumption-based estimates provide a more comprehensive and direct view of people’s well-being, making them a crucial tool in the fight against poverty and the formulation of effective policies for sustainable development.
News Source: The Hindu
 16 Aug 2023