Introduction
Macroeconomics is a branch of economics that focuses on the behavior, structure, and performance of an economy as a whole. It deals with large-scale economic factors such as national output, unemployment rates, inflation, and economic growth. Macroeconomists study how government policies, such as fiscal and monetary policies, affect these key economic indicators and how they can be used to promote economic stability and growth. They also analyse long-term economic trends and factors that influence the overall performance of an economy, such as technological progress, international trade, and demographic changes.
Economic Players
- Firms: Private entrepreneurs or firms play a key role in capitalist economies.
- They hire wage labor, use capital and land, and produce goods and services for profit.
- Government: The state enforces laws, provides public infrastructure, runs schools, and delivers public services.
- It may also undertake production and taxation.
- Household Sector: Households consist of individuals or groups that make consumption decisions, save, and pay taxes.
- They earn income through work (wages, salaries, or profits).
Some Basic Concepts of Macroeconomics
-
Final Goods
- Definition: Final goods are products meant for ultimate consumption and do not undergo further transformation in the economic process.
- Types: Final goods can be divided into consumption goods (goods consumed directly) and capital goods (durable goods used in production).
- Example: Food, tea leaves, clothing, etc.
- Intermediate Goods
- Definition: Intermediate goods are products used by producers as inputs in the production of other commodities.
- They are not considered final goods and do not enter the consumption stream directly.
- Example: Steel sheets used for making automobiles and copper used for making utensils.
-
The Role of Money
- Money is used as a common measuring rod to quantify the total value of final goods and services produced in an economy.
- Money allows for the aggregation of the monetary value of different goods and services, providing a quantitative measure of final output.
-
- Definition: Stocks are assets or goods existing at a specific point in time, while flows represent quantities over a period.
- Example: Capital goods, such as machinery, are stocks, while changes in capital goods over time are flows.
-
Gross Investment
- Gross investment encompasses capital goods and infrastructure like machinery, buildings, roads, and bridges within an economy’s final output, indicating its commitment to future development.
-
Depreciation and Net Investment
- Depreciation is an annual allowance for the wear and tear of capital goods over their useful life.
- Net investment measures the new additions to the capital stock, accounting for depreciation.
-
Consumption vs. Investment
- Economies face a trade-off between producing consumer goods and capital goods.
- Increased production of capital goods can lead to higher future production capacity and, ultimately, more consumer goods.
-
- The circular flow of income connects production and consumption.
- Firms pay income to factors of production (wages, profits, rents, and interests), which enable individuals to purchase goods and services.
-
Interconnectedness of Production and Consumption
- The production process generates factor payments, which create purchasing power for consumers.
- Capital goods play a role in this cycle by facilitating production and generating incomes.
-
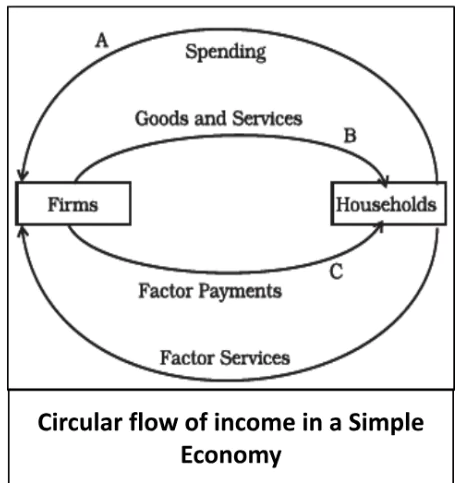
Circular Flow Of Income in the Economy
-
- The description of the economy provides a simplified model without government intervention, external trade, or savings.
- In this model, households receive income from firms for their productive activities, and there are four types of contributions: labor (wage), capital (interest), entrepreneurship (profit), and natural resources (rent).
- Refer Figure to understand the circular flow of income in a simple economy.
- Households spend their entire income on goods and services produced by domestic firms, and there are no taxes or imports.
Methods of Calculating National Income
Measurement of Aggregate Income
- Aggregate income can be measured through three methods: expenditure method, product method, and income method.
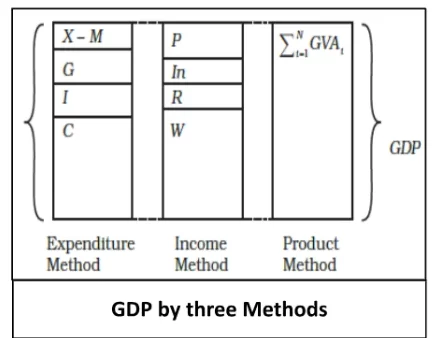 Refer to Figure to understand the GDP by three methods.
-
- Expenditure Method: Calculates aggregate income by measuring the spending firms receive for final goods and services produced.
- Product Method: Measures aggregate income by calculating the aggregate value of final goods and services produced by all firms.
- Income Method: Calculates aggregate income by summing up all factor payments (wages, interest, profit, rent).
The Product or Value Added Method
- Product Method:
- It is used to calculate the aggregate annual value of goods and services produced in an economy.
- It involves summing up the value added by all the firms in the economy.
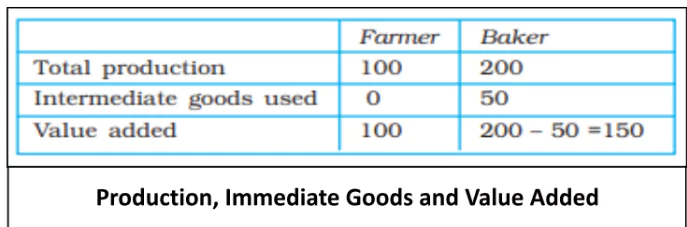
- Example: The example involves two types of producers – wheat producers (farmers) and bread makers (bakers).
- In a year, farmers produce wheat with a total value of Rs 100, out of which they sell Rs 50 worth of wheat to bakers.
- The bakers use this wheat to produce bread with a value of Rs 200.
 Value Added
-
- The term that is used to denote the net contribution made by a firm is called its value added.
- Value added by a firm is calculated as the value of production minus the value of intermediate goods used (Refer Table).
- For the farmers, their value added is Rs 100 (the entire value of their wheat production).
- For the bakers, their value added is Rs 200 (bread production) minus Rs 50 (the value of wheat they bought from the farmers), which equals Rs 150.
Gross Value Added and Net Value Added
- Gross Value Added: If we include depreciation in value added then the measure of value added that we obtain is called Gross Value Added.
- Net Value Added: If we deduct the value of depreciation from gross value added we obtain Net Value Added.
- Unlike gross value added, net value added does not include wear and tear that capital has undergone.
- Example: Let us say a firm produces Rs 100 worth of goods per year, Rs 20 is the value of intermediate goods used by it during the year and Rs 10 is the value of capital consumption.
- The gross value added of the firm will be Rs 100 – Rs 20 = Rs 80 per year.
- The net value added will be, Rs 100 – Rs 20 – Rs 10 = Rs 70 per year.
Inventory
- Definition: Inventory in economics refers to the stock of unsold finished or raw goods a firm holds from one year to the next, with changes indicating accumulation (increase) or decumulation (decrease) in value over time.
- Significance: It’s a crucial variable for assessing a company’s production and sales dynamics.
- The change of inventories of a firm during a year ≡ production of the firm during the year – sale of the firm during the year. (≡ means identity)
- Example: Let us suppose that a firm had an unsold stock worth Rs 100 at the beginning of a year. During the year it had produced Rs 1,000 worth of goods and managed to sell Rs 800 worth of goods.
- Therefore, Rs 200 is the difference between production and sales. This Rs 200 worth of goods is the change in inventories.
- This will add to the Rs 100 worth of inventories the firm started with. Hence the inventories at the end of the year is, Rs 100 + Rs 200 = Rs 300.
- Notice that change in inventories takes place over a period of time. Therefore it is a flow variable.
- Investment: Inventories are treated as capital and addition to the stock of capital of a firm is known as investment. Therefore, a change in the inventory of a firm is treated as an investment.
- Categories of Investment: Three major categories of investment are as follows:
- Inventory Investment: This involves the increase in the value of a firm’s inventories over a year, considered as an investment expenditure made by the firm.
- Fixed Business Investment: It comprises investments in machinery, factory buildings, and equipment by firms to enhance their production capabilities.
- Residential Investment: This category relates to investments made in housing facilities, such as construction and improvement of residential properties.
- Types of Inventory Changes: Change in inventories can be planned or unplanned.
- Unplanned Accumulation of Inventories: It occurs when sales fall unexpectedly, resulting in unsold goods beyond expectations.
- Unplanned Decumulation of Inventories: It happens when there’s an unexpected increase in sales, reducing inventories more than anticipated.
- Note: If we sum the gross value added of all the firms of the economy in a year, we get a measure of the value of the aggregate amount of goods and services produced by the economy in a year (just as in the wheat-bread example). Such an estimate is called Gross Domestic Product (GDP).
- Thus GDP ≡ Is the total gross value added of all the firms in the economy.
Expenditure Method
- Demand-Side Approach: An alternative approach to calculating GDP is through the expenditure method, which focuses on the demand side of products.
- Example: The Rs 50 worth of wheat that the bakers buy from the farmers counts as intermediate goods, hence it does not fall under the category of final expenditure.
- Therefore the aggregate value of output of the economy is Rs 200 (final expenditure received by the baker) + Rs 50 (final expenditure received by the farmer) = Rs 250 per year.
- Determining Aggregate Output: In the example of the farmer-baker economy described earlier, the aggregate value of the output in the economy using the expenditure method is determined as follows:
- Calculation of Final Expenditures: Calculate the final expenditures made by each firm. Final expenditure refers to spending, not for intermediate purposes.
- Calculation of Total Revenues: Sum up the revenues earned by each firm from final consumption (C), investment (I), government spending (G), and exports (X).
- This is represented as RVi for each firm.
- For the entire economy, calculate the aggregate final consumption expenditure (C), which includes spending on domestic firms but excludes spending on imported consumption goods (Cm).
- Calculate the aggregate final investment expenditure (I), which includes spending on domestic firms but excludes spending on foreign investment goods (Im).
- Determine the aggregate final government expenditure (G) for the economy, which includes spending on domestic firms but excludes spending on imports (Gm).
- Calculate the aggregate exports (X) received by the economy from foreign buyers.
- Subtract the aggregate imports expenditure (M), which includes spending on imports of consumption goods (Cm), imports of investment goods (Im), and government spending on imports (Gm).
- Expression of GDP Using the Expenditure Method: as GDP = C + I + G + X – M.
- This equation provides a way to calculate GDP based on final expenditures on consumption, investment, government spending, exports, and imports.
- It is worth noting that investment expenditure (I) is often the most variable component in this calculation.
Income Method
- The income method of calculating GDP focuses on the incomes received by all the factors of production, such as labor, capital, entrepreneurship, and land. It establishes a relationship between the sum of final expenditures in the economy and the incomes earned by households and factors of production.
- Here’s how the income method is applied:
- Consider there are M households in the economy, and let Wi represent the wages and salaries received by the i-th household, Pi for gross profits, Ini for interest payments, and Ri for rents in a specific year.
- GDP is calculated as the sum of these various income components: GDP = Σ(Wi) + Σ(Pi) + Σ(Ini) + Σ(Ri). (The symbol Σ is a notation – it is used to denote summation.)
- The total income earned by all households is expressed as GDP.
- This method essentially states that the revenues earned by all firms in the economy should be distributed among the factors of production such as salaries, wages, profits, interest earnings, and rents.
- When considering the income method along with the value-added method and expenditure method, they all provide different expressions of the same GDP variable.
- These methods represent the relationship between production, expenditure, and income.
Factor Cost, Basic Prices, and Market Prices
- The Central Statistics Office (CSO) of the Government of India has been reporting the GDP at factor cost and at market prices. In its revision in January 2015 the CSO replaced GDP at factor cost with the GVA at basic prices, and the GDP at market prices, which is now called only GDP, is now the most highlighted measure.
- The measurement of national income in India involves various concepts such as GDP at factor cost, GDP at market prices, GVA at basic prices, and the distinction between production taxes and product taxes, as well as subsidies.
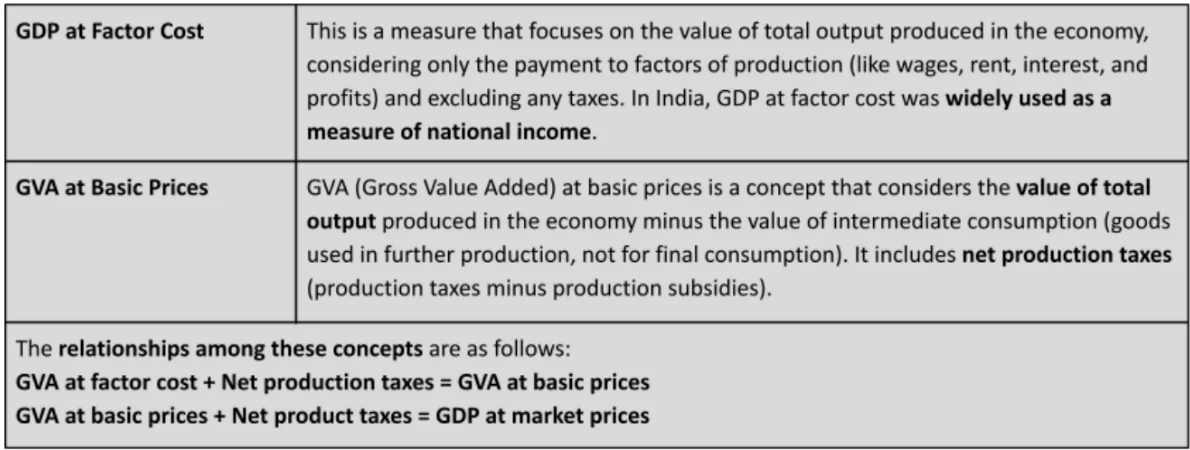
- Shift in Focus from GDP at Factor Cost to GVA at Basic Prices: In recent years, the Central Statistics Office (CSO) of the Government of India has shifted its focus from GDP at factor cost to GVA at basic prices as a key measure of national income.
- This change highlights the importance of understanding the distinction between various taxes and subsidies related to production and products in calculating national income.
Some Macroeconomic Identities
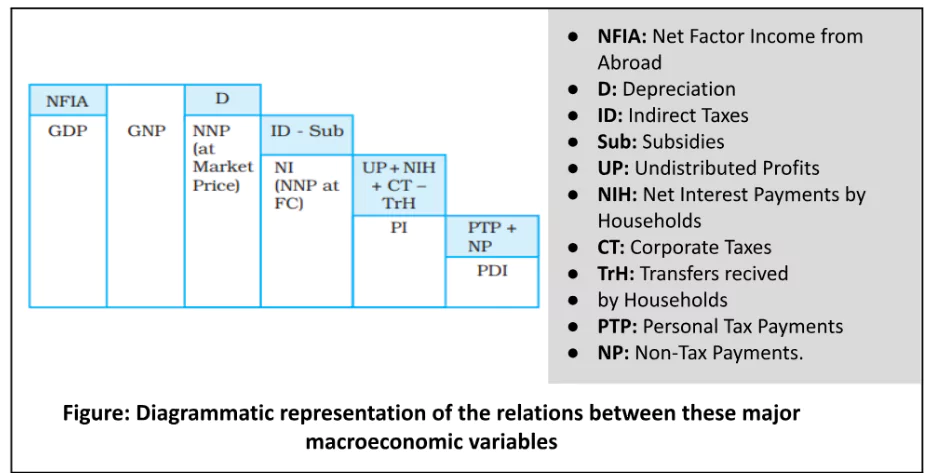
- There are various macroeconomic identities and concepts related to national income measurement, including Gross National Product (GNP), Net National Product (NNP), National Income (NI), Personal Income (PI), and Personal Disposable Income (PDI).
- These identities help in understanding how income is distributed within an economy and how it is affected by various factors like depreciation, taxes, subsidies, and transfers.
- Gross National Product (GNP): GNP represents the total economic output produced within a country, including income earned by domestic factors of production abroad minus income earned by foreign factors of production within the country. It is calculated as GDP plus net factor income from abroad.
GNP = GDP + Net Factor Income from Abroad
- Net National Product (NNP): NNP is obtained by subtracting depreciation (wear and tear of capital) from GNP. Depreciation does not contribute to anyone’s income, so it is deducted to obtain a more accurate measure of income.
NNP = GNP – Depreciation
- National Income (NI): NI is NNP evaluated at market prices, taking into account indirect taxes and subsidies. It represents the income that accrues to factors of production within the country.
NI = NNP at Market Prices – Net Indirect Taxes (Indirect Taxes – Subsidies)
Note
- All these variables are evaluated at market prices. We get the value of NNP evaluated at market prices. But market price includes indirect taxes.
- When indirect taxes are imposed on goods and services, their prices go up. Indirect taxes accrue to the government.
- We have to deduct them from NNP evaluated at market prices in order to calculate the part of NNP that actually accrues to the factors of production.
- Similarly, there may be subsidies granted by the government on the prices of some commodities (in India petrol is heavily taxed by the government, whereas cooking gas is subsidised).
- So we need to add subsidies to the NNP evaluated at market prices.
- The measure that we obtain by doing so is called Net National Product at factor cost or National Income.
|
Personal Income (PI):
- PI is the income received by households from NI.
- Calculation of Personal Disposable Income: It is calculated by deducting undistributed profits, corporate tax, and net interest payments made by households, and adding transfer payments received from the government and firms.
PI = NI – Undistributed Profits – Net Interest Payments Made by Households – Corporate Tax + Transfer Payments to Households.
- Undistributed Profits: NI, which is earned by the firms and government enterprises, a part of profit is not distributed among the factors of production.
- Transfer Payments: The households receive transfer payments from the government and firms (pensions, scholarships, prizes, for example) which have to be added to calculate the Personal Income of the households.
- National Disposable Income = Net National Product at market prices + Other current transfers from the rest of the world
- The idea behind National Disposable Income is that it gives an idea of what is the maximum amount of goods and services the domestic economy has at its disposal.
- Current transfers from the rest of the world include items such as gifts, aids, etc.
- Private Income= Factor income from net domestic product accruing to the private sector + National debt interest + Net factor income from abroad + Current transfers from government + Other net transfers from the rest of the world.
|
- PDI is the income available to households after deducting personal tax payments (such as income tax) and non-tax payments (like fines) from PI.
- It represents the income that households have at their disposal for consumption or savings.
PDI = PI – Personal Tax Payments – Non-Tax Payments
Nominal GDP
- Definition: Nominal GDP is the total value of goods and services produced in an economy at current market prices.
- It does not account for changes in prices over time.
- Example: Suppose a country only produces bread. In the year 2000 it had produced 100 units of bread, price was Rs 10 per bread. GDP at current price was Rs 1,000.
- In 2001 the same country produced 110 units of bread at price Rs 15 per bread. Therefore nominal GDP in 2001 was Rs 1,650 (=110 × Rs 15).
- Real GDP in 2001 calculated at the price of the year 2000 (2000 will be called the base year) will be 110 × Rs 10 = Rs 1,100.
Real GDP
- Definition: Real GDP is a measure of economic output that adjusts for changes in prices.
- It evaluates goods and services at constant (base-year) prices, allowing for a comparison of production volumes across different years.
- Significance: Real GDP helps eliminate the impact of price changes, making it a useful tool for assessing actual changes in economic production.
Real GDP = (Nominal GDP / GDP Deflator) * 100
GDP Deflator
- Definition: The GDP deflator is an index that measures the average change in prices of all goods and services included in GDP over time.
- A GDP deflator of 150% implies that prices have increased by 50% compared to the base year.
- It is calculated as the ratio of nominal GDP to real GDP, expressed as a percentage.
GDP Deflator = (Nominal GDP / Real GDP) * 100
Consumer Price Index (CPI):
- The CPI measures changes in the prices of a fixed basket of goods and services typically purchased by a representative consumer.
- It quantifies the inflation experienced by consumers.
- CPI is expressed as a percentage change in prices from a base year.
CPI = (Cost of Basket in Current Year / Cost of Basket in Base Year) * 100
- The WPI is an index that tracks changes in the prices of goods at the wholesale level.
- Significance: It is used to assess inflation in the early stages of production and distribution.
- In some countries, it may be referred to as the Producer Price Index (PPI).
Differences Between CPI and GDP Deflator
| CPI |
GDP Deflator |
- The goods purchased by consumers do not represent all the goods which are produced in a country
|
- The GDP deflator takes into account all such goods and services.
|
- CPI includes prices of goods consumed by the representative consumer, hence it includes prices of imported goods.
|
- The GDP deflator does not include prices of imported goods.
|
- The weights are constant in CPI
|
- they differ according to the production level of each good in the GDP deflator.
|
GDP And Welfare
- Using Gross Domestic Product (GDP) as a sole indicator of the welfare of a country’s people has its limitations, and there are several reasons why GDP may not accurately reflect the overall well-being of a nation:
- Income Distribution
- GDP measures the total economic output of a country, but it does not provide information about how that output is distributed among its citizens.
- If GDP increases, but the gains are concentrated in the hands of a few individuals or entities, the majority of the population may not experience improved welfare.
- Unequal income distribution can lead to disparities in well-being.
- Non-Monetary Exchanges
- Many valuable activities in an economy are not monetized or included in GDP calculations.
- Example: Domestic work performed at home, volunteer activities, and barter exchanges (where goods and services are directly swapped without money) are not typically accounted for in GDP.
- This omission can result in an underestimation of economic activity and well-being.
- Externalities
-
- GDP does not consider externalities, which are unintended side effects of economic activities, which can be positive or negative.
- Example:
- Negative Externalities: A factory may contribute to GDP growth, but if it also pollutes a nearby river, causing harm to local communities and ecosystems, this harm is not reflected in GDP.
- Positive Externalities: Such as education and research, may enhance well-being but are not directly captured by GDP.
Conclusion
- Macroeconomics focuses on the study of aggregate economic variables and the interrelationships among different sectors of an economy.
- It emerged in response to the Great Depression of the 1930s, with John Maynard Keynes playing a significant role in its development.
- Macroeconomics views an economy as consisting of households, firms, government, and the external sector, all interacting in a circular flow.
- Methods for calculating aggregate income, including income, product, and expenditure approaches, have been discussed, along with various economic indicators like GDP, GNP, and price indices.
- However, it is essential to recognize that GDP alone may not accurately represent the overall welfare of a country, considering factors such as income distribution and externalities.
Basic National Income Aggregates
| 1 |
Gross Domestic Product at Market Prices (GDPMP) |
- GDP is the market value of all final goods and services produced within a domestic territory of a country measured in a year.
- All production done by the national residents or the non-residents in a country gets included, regardless of whether that production is owned by a local company or a foreign entity.
- Everything is valued at market prices.
- GDPMP = C + I + G + X – M
|
| 2 |
GDP at Factor Cost (GDPFC) |
- GDP at factor cost is gross domestic product at market prices, less net product taxes.
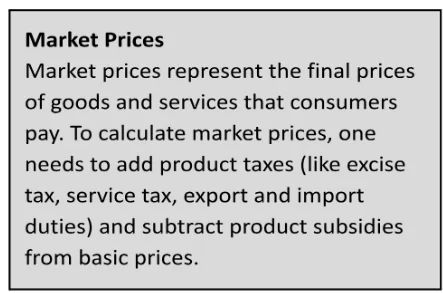
- Market prices are the prices as paid by the consumers Market prices also include product taxes and subsidies.
- The term factor cost refers to the prices of products as received by the producers. Thus, factor cost is equal to market prices, minus net indirect taxes.
- GDP at factor cost measures the money value of output produced by the firms within the domestic boundaries of a country in a year.
- GDPFC = GDPMP – NIT
|
| 3 |
Net Domestic Product at Market Prices (NDPMP) |
- This measure allows policy-makers to estimate how much the country has to spend just to maintain their current GDP.
- If the country is not able to replace the capital stock lost through depreciation, then GDP will fall.
- NDPMP = GDPMP – Dep
|
| 4 |
NDP at Factor Cost (NDPFC) |
- NDP at factor cost is the income earned by the factors in the form of wages, profits, rent, interest, etc., within the domestic territory of a country.
- NDPFC = NDPMP – Net Product Taxes – Net Production Taxes
|
| 5 |
Gross National Product at Market Prices (GNPMP) |
- GNPMP is the value of all the final goods and services that are produced by the normal residents of India and is measured at the market prices, in a year.
- GNP refers to all the economic output produced by a nation’s normal residents, whether they are located within the national boundary or abroad.
- Everything is valued at the market prices.
- GNPMP = GDPMP + NFIA
|
| 6 |
GNP at Factor Cost (GNPFC) |
- GNP at factor cost measures the value of output received by the factors of production belonging to a country in a year.
- GNPFC = GNPMP – Net Product Taxes – Net Production Taxes
|
| 7 |
Net National Product at Market Prices (NNPMP) |
- This is a measure of how much a country can consume in a given period of time.
- NNP measures output regardless of where that production has taken place (in domestic territory or abroad).
- NNPMP = GNPMP – Depreciation
- NNPMP = NDPMP + NFIA
|
| 8 |
NNP at Factor Cost (NNPFC)
Or National Income (NI) |
- NNP at factor cost is the sum of income earned by all factors in the production in the form of wages, profits, rent and interest, etc., belonging to a country during a year.
- It is the National Product and is not bound by production in the national boundaries.
- It is the net domestic factor income added with the net factor income from abroad.
- NI = NNPMP – Net Product Taxes – Net Production Taxes = NDPFC + NFIA = NPFC
|
| 9 |
GVA at Market Prices |
|
| 10 |
GVA at basic prices |
- GVAMP – Net Product Taxes
|
| 11 |
GVA at factor cost |
- GVA at basic prices – Net Production Taxes
|
 April 8, 2024