Recently, the Ministry of Statistics and Programme Implementation (MoSPI) launched a new Index of Industrial Production (IIP) series with 2022-23 as the base year, replacing 2011-12, to better reflect current industrial growth, emerging sectors, and changing consumer demand.
- The 2022-23 update marks the 10th time the base year has been revised since the index started in undivided India.
- The first-ever IIP was made using the year 1937. This latest change was guided by the Technical Advisory Committee for Base Year Revision (TAC-IIP) to drop the old, out-of-date 2011-12 system.
UPSC Coaching Classes
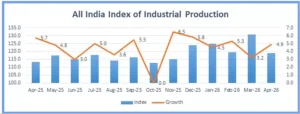
Key Performance Snapshot- April 2026 (New Series)
- Overall Industrial Growth: India’s factory output grew by 4.9% in April 2026 compared to April 2025 (where it stood at 5.8%), showing a stable growth pace.
- Manufacturing Strength: The Manufacturing sector, which holds the largest share of the index with a 76.06% weight, recorded a strong growth of 6.2%, driven by electrical machinery and vehicles.
- Mining Slowdown: On the other side, the Mining and Quarrying sector faced a drop, shrinking by (-)5.1% due to lower production in fuel and minerals.
- Use-Based Trends: Factory building showed high activity as Capital Goods rose by 16.0%, followed by a 7.1% increase in Infrastructure/Construction Goods.
- However, basic consumer goods showed slower growth.
About Index of Industrial Production (IIP): (UPSC CSE Pre 2012)
The Index of Industrial Production (IIP) is a key monthly economic indicator that measures the short-term changes in the volume of goods produced by factories and industries.
- The Core Mechanism: Published on the 12th of every month by the National Statistical Office (NSO) under MoSPI, the baseline index value is always set at 100.
- Current and future production is measured as a percentage against this score.
- Economic Importance: Because formal GDP data comes out only once every three months, the monthly IIP serves as an early check on the economy.
- It helps the Reserve Bank of India (RBI) and policymakers judge business speed, predict economic growth, and fix interest rate policies.
Need for Changing the Base Year
The older framework had to be updated due to several reasons:
- Capturing Emerging Sectors: To include fast-growing industries that did not exist or were very small back in 2011.
- Fixing Production Patterns: To correct old data balances caused by declining industries.
- Evolving Consumption Trends: To match factory data with what people and businesses actually buy today.
- Global Best Practices: To align India’s methods with United Nations guidelines.
Major Changes in the 2022-23 Framework
The new setup brings big updates to how industrial data is grouped, counted, and tracked:
- Broadened Sectoral Coverage: The index has expanded beyond the regular three sectors of Mining, Manufacturing, and Electricity.
- A brand-new utility sector—Water Supply, Sewerage & Waste Management (2.02% weight)—has been added.
- Also, the energy sector now includes Gas Supply along with regular electricity.
- Detailed Tracking:
 Green Energy Transition: The Electricity index now separates Renewable Sources (like solar, wind, and hydro) from Non-Renewable Sources (like thermal and nuclear) to track India’s shift to clean energy.
- Inclusive Mining Classification: Mining is now split into three detailed areas:
- Fuel Minerals, Metallic Minerals (including Rare Earths), and
- Non-Metallic Minerals (including minor minerals). This ensures local mining work is fully captured.
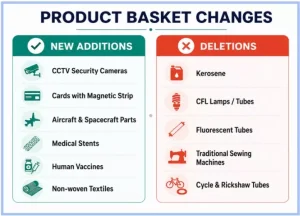
- Revamped Item Basket: The product list expanded from 839 items to 1,042 products, grouped into 463 item groups (up from 407).
- The items added and dropped show India’s changing industrial priorities.
- Panel Changes and New Sources: To prevent data issues when factories close, the new system includes a Factory Substitution Clause to switch out closed factories for working ones.
- Additionally, the number of data-collecting groups grew from 12 to 16 Source Agencies.
Sectoral Weightage- Base 2011-12 vs. Base 2022-23
The weights assigned to each sector have been updated using the latest Gross Value Added (GVA) data. This has slightly shifted importance away from traditional mining and manufacturing towards green energy and utilities:
Click to Know UPSC OnlyIAS Coaching Centres
| Sectoral Classification |
2011-12 Weights (%) |
2011-12 Item Groups |
2022-23 Weights (%) |
2022-23 Item Groups |
| Mining & Quarrying |
14.372 |
1 |
11.053 |
3 |
| Manufacturing |
77.633 |
405 |
76.062 |
455 |
| Electricity & Gas Supply |
7.995 |
1 |
10.865 |
3 |
| Water Supply, Sewerage & Waste Management |
Not Covered |
Not Covered |
2.020 |
2 |
| Total General Index |
100.00% |
407 |
100.00% |
463 |
 4 Jun 2026